Getting a good analysis
The most important factor in getting good data (other than good recordings) is setting appropriate analysis ranges. The range should include the correct analysis and exclude very wrong analyses (as sometimes these can be difficult to distinguish from correct analyses). As a result, it should be wide but not too wide.
These are the (very rough) guidelines given in the menu window for the tracking functions:
Appropriate highest and lowest frequencies will vary as a function of talker vocal-tract length
which is strongly related to height across all speakers. Talkers can be grouped into broad categories of:
   tall (>5 foot 8): recommended range 4500-6500 Hz
   medium (5 foot 8 >  > 5 foot 0): recommended range 5000-7000 Hz
   short (<5 foot 0) recommended range 5500-7500 Hz
These categories correspond roughly to adult males, adult females (and teenagers),
and younger children. However, there is substantial overlap between categories and variation
within-category, so that adjustments may be required for individual voices.
These very general guidelines are reasonable starting points based on broad trends. They may work for most voices, however, individual voices may require more attention be paid to the specific ranges.
-
if you have lots of data for each speaker, may as well analyze each speaker in a different folder. This means you can specify analysis ranges that are appropriate for that speaker.
-
if you need to mix speakers, you can try to group them approximately into broad size categories as suggested above.
-
if analyses are often wrong and also often one of the first considered, your ranges need to be increased.
-
conversely, if analyses are often wrong and also often one of the last considered, your ranges need to be decreased.
-
if the analysis is ignoring good tracks and picking bad tracks, the good tracks may be violating some heuristics.
The optimal analysis 'Maximum Formant' setting (i.e., the frequency below which you look for formants) depends on:
-
the talker: taller speakers with longer vocal tract produce lower formants overall, and require higher maximum formant settings.
-
the vowel category: vowels with higher F3 and F4 frequencies (high front vowels) will require higher maximum formant settings.
Speaker vocal tract length varies very predictably (but noisily) as a function of talker height across all speakers. This also varies in approximately the same way between men (circles) and women (crosses) as seen on the left below (from this paper). As a result, all other things being equal, approximately the same analysis ranges are likely appropriate for men and women of the same height.
The plot on the right (based on data available here) shows the average heights of males (blue) and females (red) aged 2-20 years of age, and 2 standard deviations of the distribution about the mean.
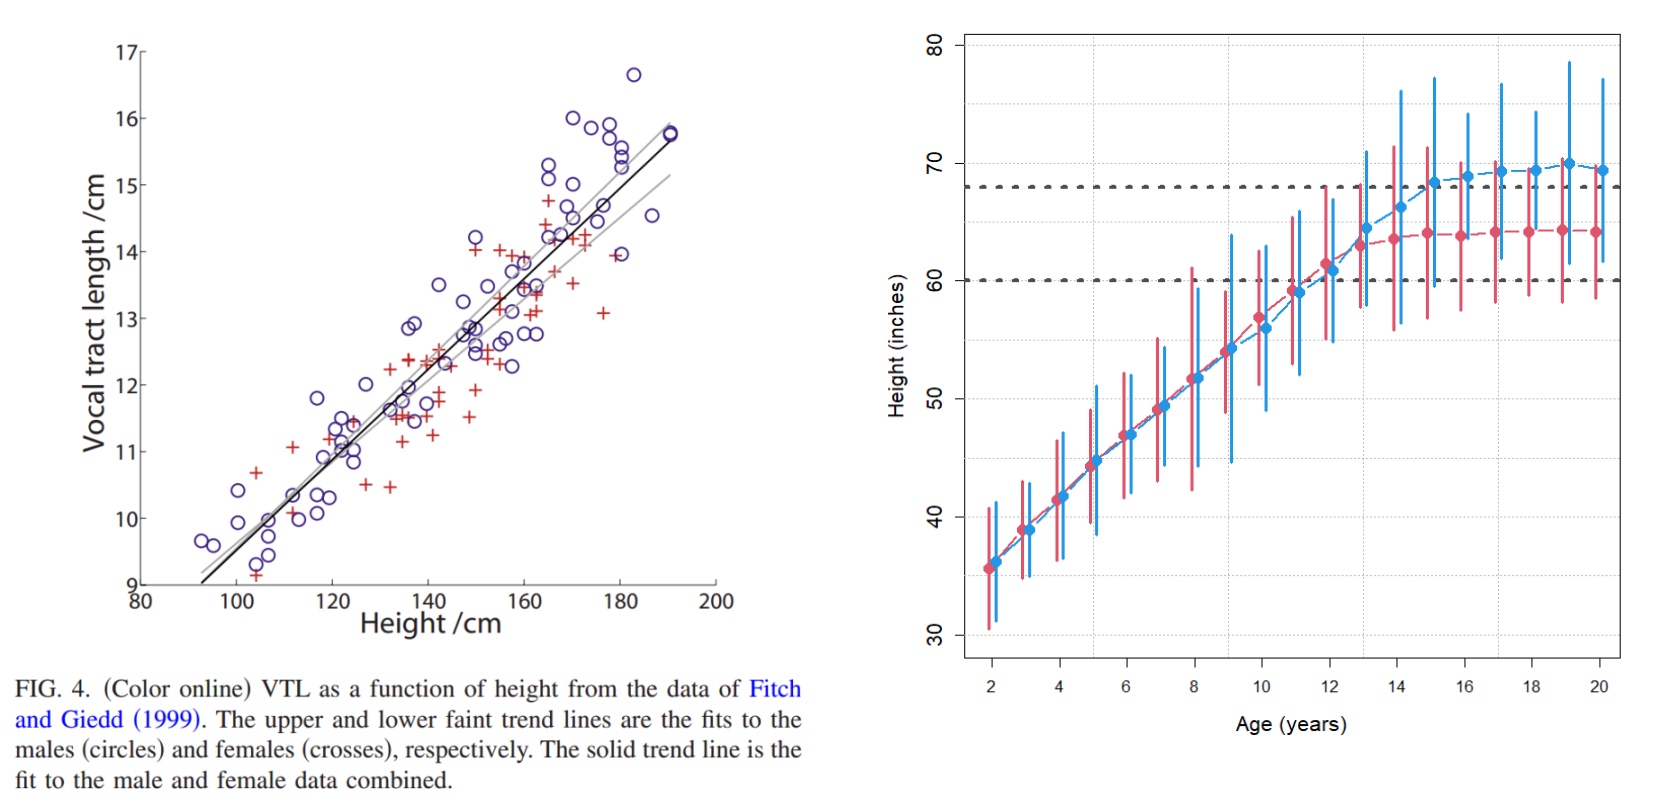
The horizontal lines above correspond to the cutoffs for suggested size groups. As can be seen above, the suggested groups correspond roughly to:
-
large: about half of adult males and older male teens, and a small amount of adult females and teenagers.
-
medium: most adult females and teens, and younger male teenagers.
-
small: younger, pre-pubescent children.
I carried out an analysis to see which ranges resulted in the least errors for the men, women and children (aged 10-12) in the Hillenbrand et al. (1995) data. The analysis is described in this paper. The results are presented in the image below for (a) men (b) women (c) boys and (d) girls. In each plot, dotted lines represent individual talkers, and the bold lines indicate group averages. (d) Shows a comparison of similar talkers from across categories, and (e) shows the results for four different women. In each case, we see that there can be substantial variation within and across speaker classes, highlighting the need to adjust settings for individual speakers beyond a 'male' 'female' dichotomy.
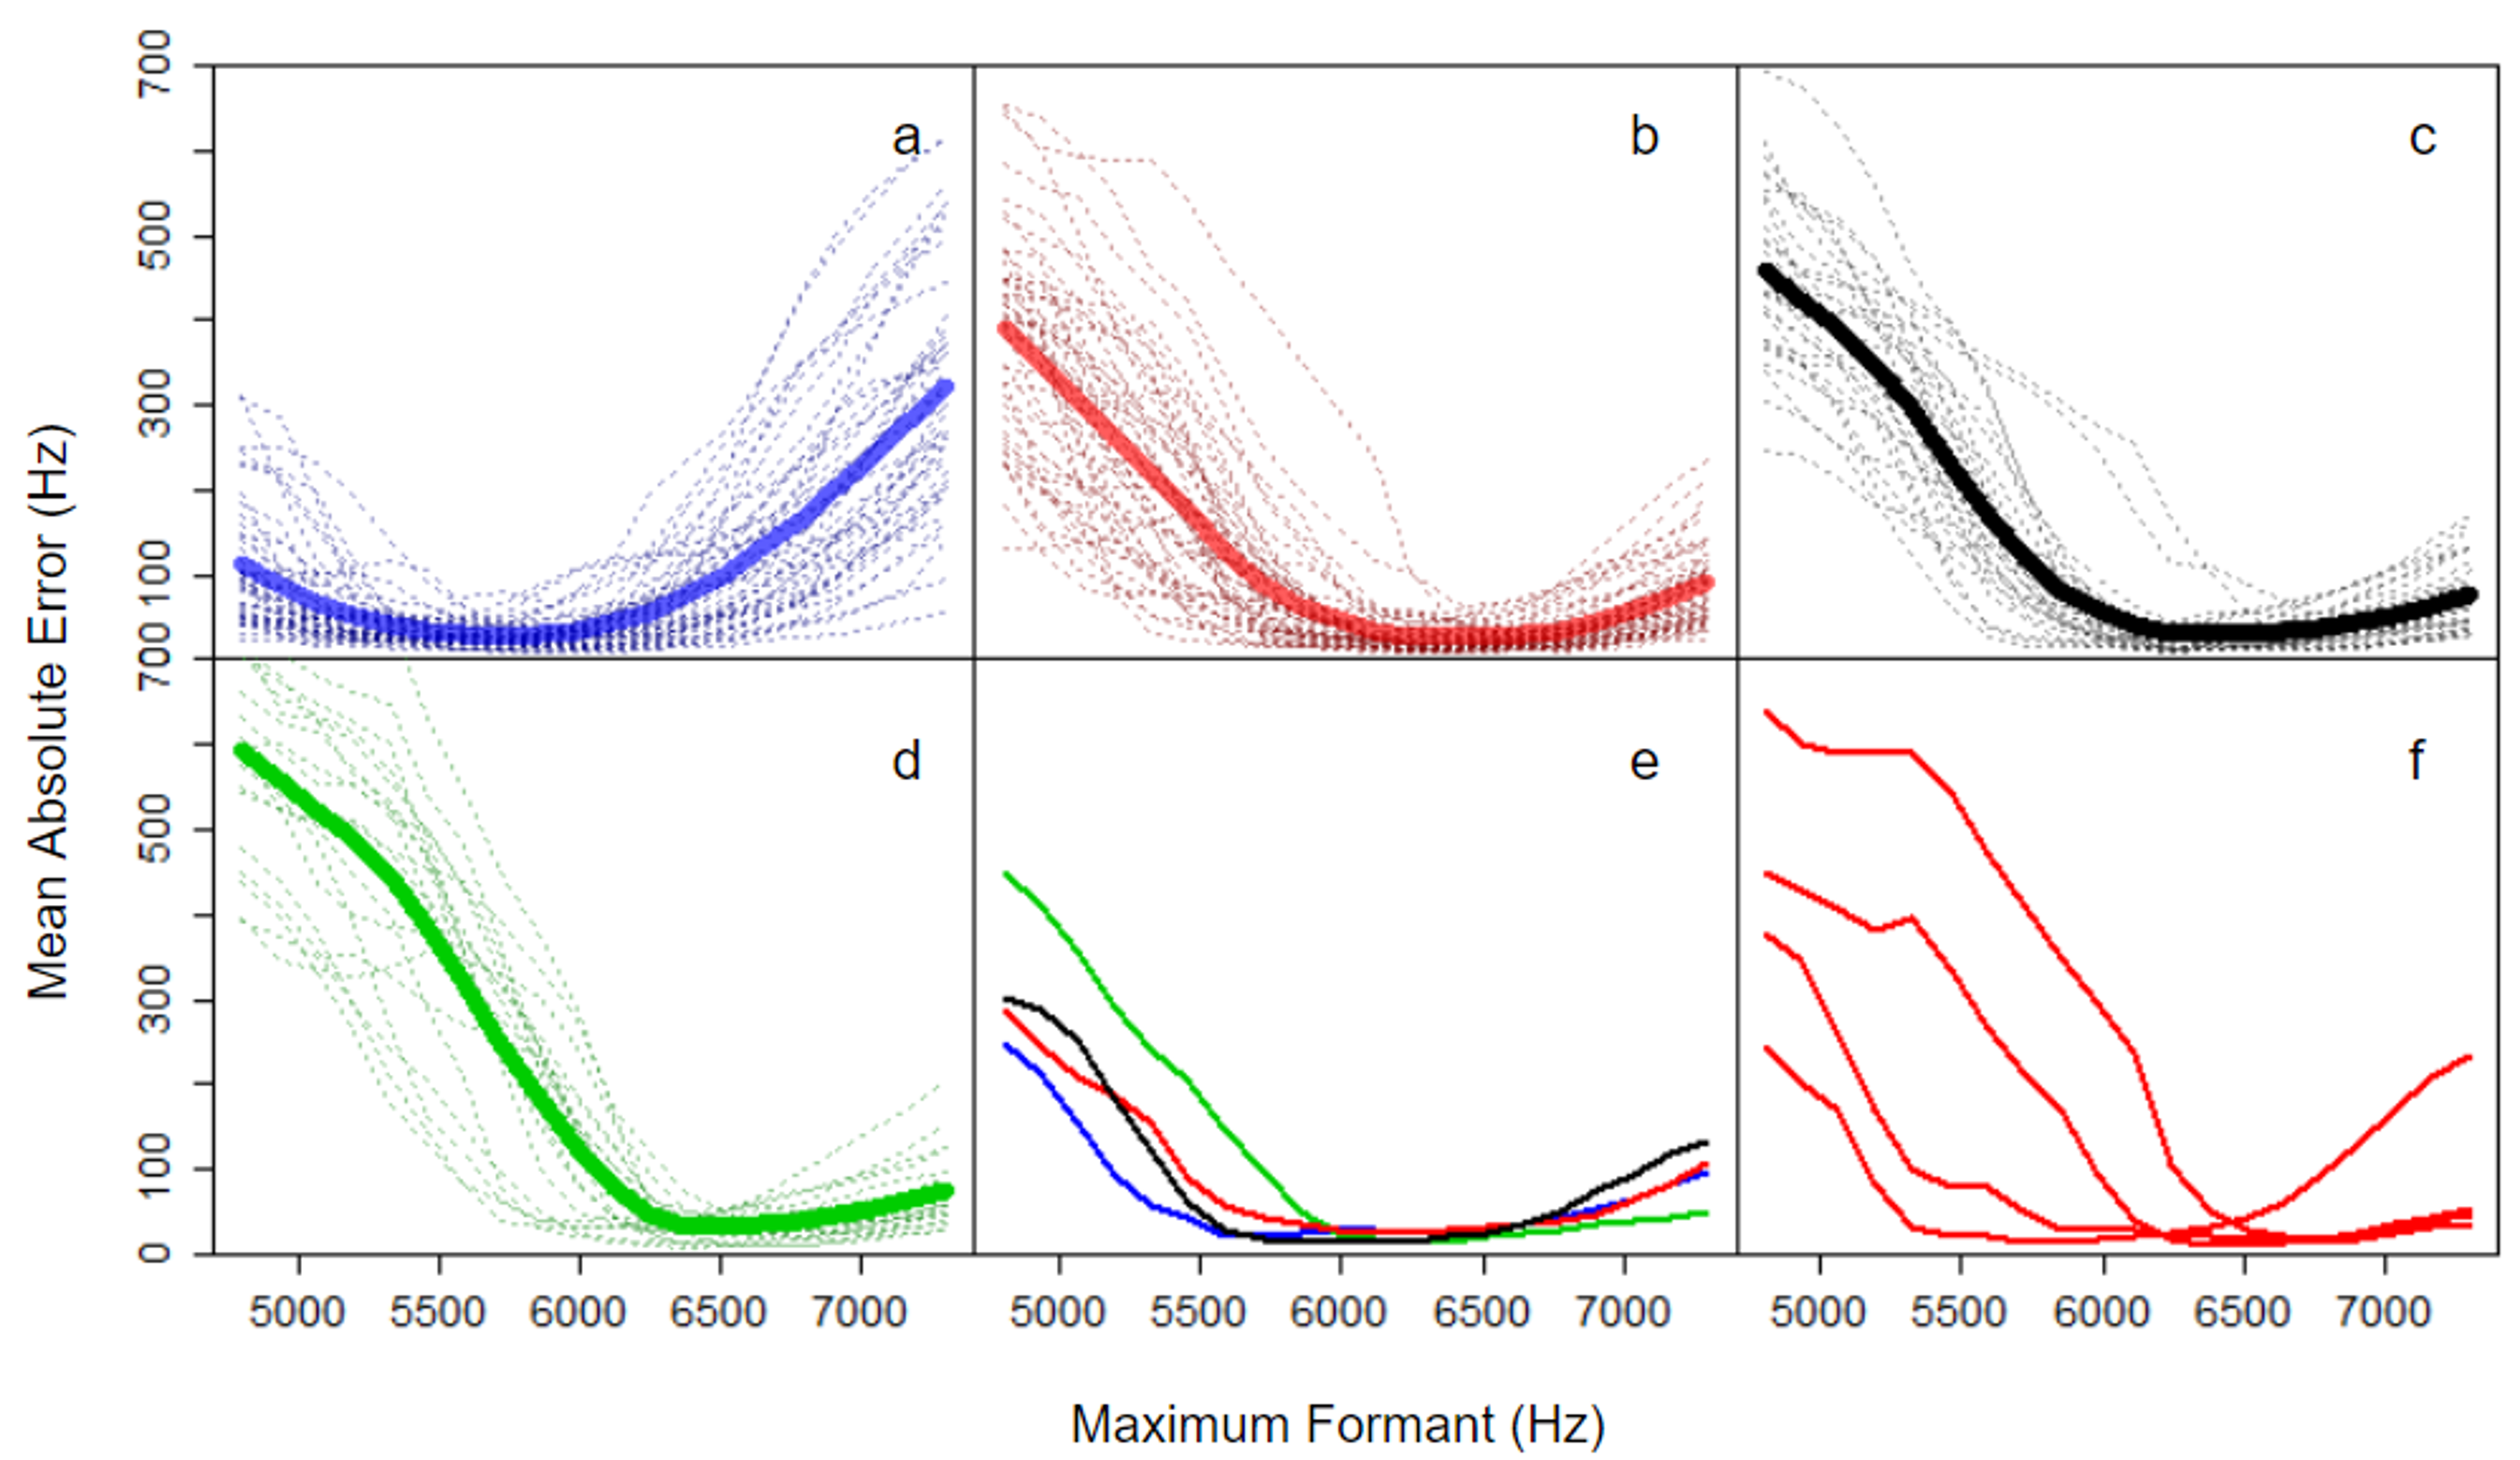
The plot above shows that we can get accurate results with a wide range of analysis frequencies. However, some analysis frequencies primarily introduce large errors into our analyses, which can only need to more mistakes. The suggested guidelines above take into account the ranges than tended to be accurate for different kinds of speakers, while omitting ranges that only tended to increase errors for classes of speakers. For example, the suggested ranges for large speakers above contain the lowest-error section for the bold blue curve in (a) above.