Home
- Packages - names should be lower case only, subsequent words are just appended to the end, e.g. helloworld
- Classes - use CamelCasing for names, starting with UPPER case
- Methods - use camelCasing for names, starting with lower case
- Variables - use camelCasing for names, starting with lower case
- Fields - put underscore ( _ ) before variable names
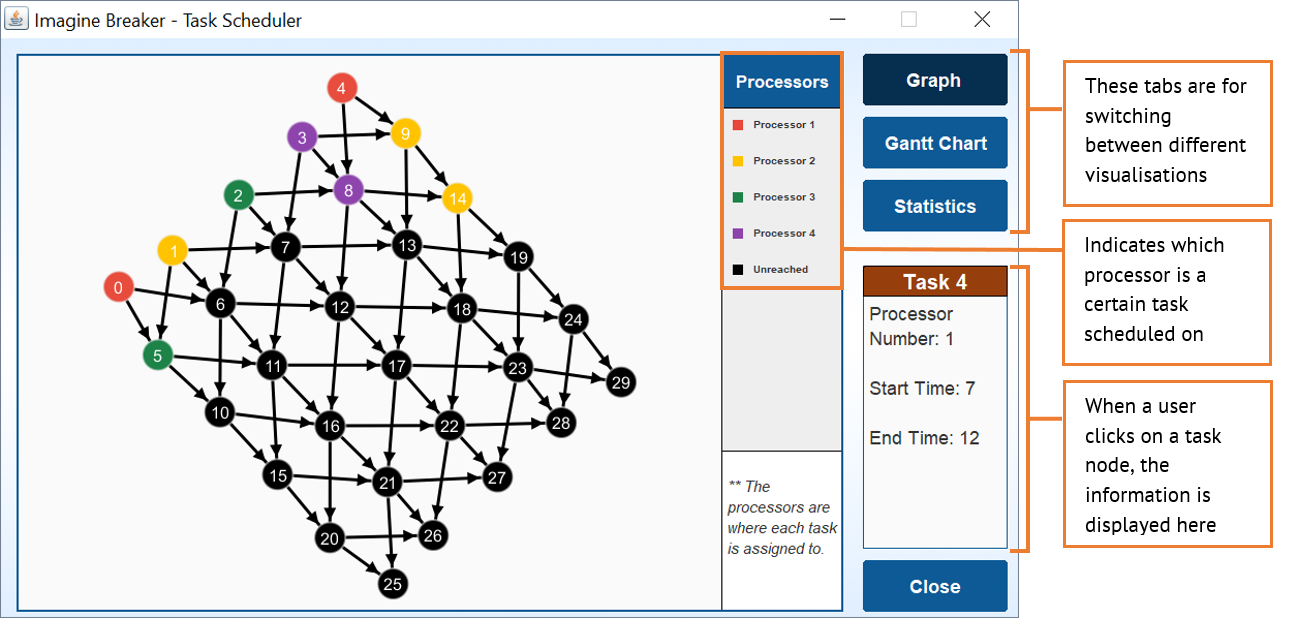
Graph and Gantt Chart display the current schedule that is being examined by our task scheduler's A* implementation.
Statistics Table displays the current progress of the A* implementation.
When the visualisation stops changing, the optimal solution is found and is displayed.
The Close button will cause the Task Scheduler to exit.
- Graph displayed is a proper representation of the input graph.
- Each node represents a task and the colour changes based on the processor it is scheduled on.
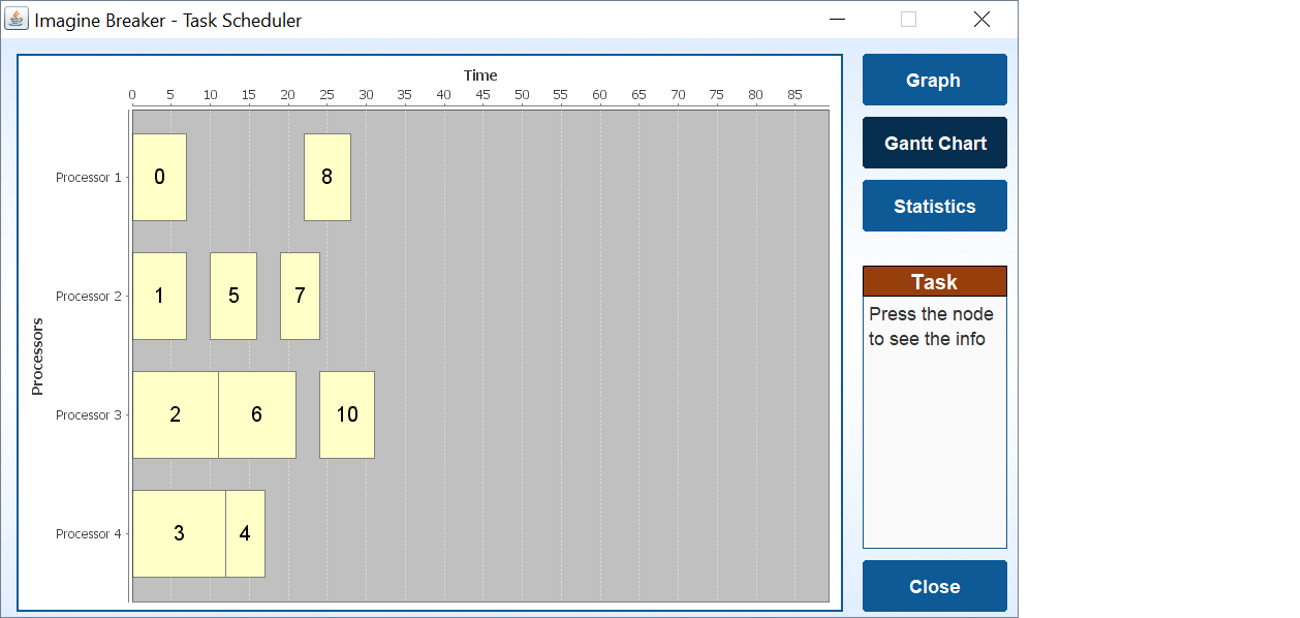
The Gantt Chart represents the schedule that is being examined at the point of time.
- Each task that has been scheduled will be represented by a block which size depends on the weight.
- The latest time any task block will be the last finishing time of the schedule.
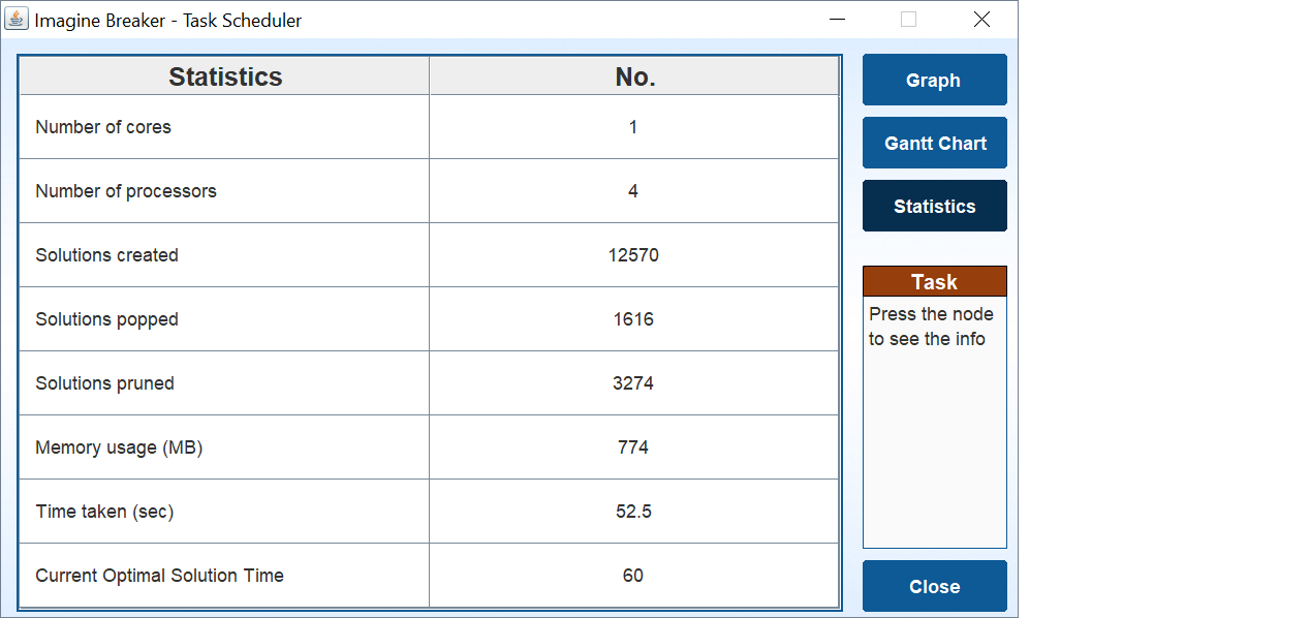
Statistics:
- Solutions created - The number of partial/complete schedules created since the start of the program
- Solutions popped - The number of schedules popped from the OPEN set.
- Solutions pruned - The number of schedules that have been deemed unpromising and so not examined.
- Current optimal solution time - The cost function of the current partial schedule or the last finishing time of any processors on a complete schedule.
Refer to the A* page for more details.