[Tutorial] Conversion of point cloud data to 3D tiles
This tutorial shows how to convert a point cloud in LAS format (.las file) to 3D Tiles.
See the Prerequisites section before starting this tutorial.
Create a point cloud in 3D Tiles format given as input data the 1916.las and 1916.tif.
The 3D Tiles will be colorized with the RGB values from the 1916.tif ortophoto image.
The workflow graph is presented below, highlighting steps and tools:
graph LR;
    las("Point Cloud (.las)")-->las_processing[Processing with PDAL]-->py3dtiles-->3d_point_cloud((3DTiles));
Select the Pipelines menu item in the left sidebar and then click on the + Add Pipeline to create a new pipeline.
In the Add Pipeline dialog enter Point Cloud as title and select the 1916.las from the asset dropdown then click on save.

A new pipeline is available in the table, click on the title to enter the edit page

Edit available fields with following values:
- Select the
1916.tifimage inside theImage for colorizationfield - Apply a vertical datum shift checking the
Convert to ellipsoidal heightfield. The Cesium viewer expects altitude above the ellipsoid for this reason we need to convert it when the original data has elevation above the see level (as in the1916.lasfile) - Add a geometric error scale factor of
0.15

Generate 3D Tiles by clicking on the Run button. (The generated tileset can be downloaded from the user interface with the download icon near the SUCCESS status tag.)
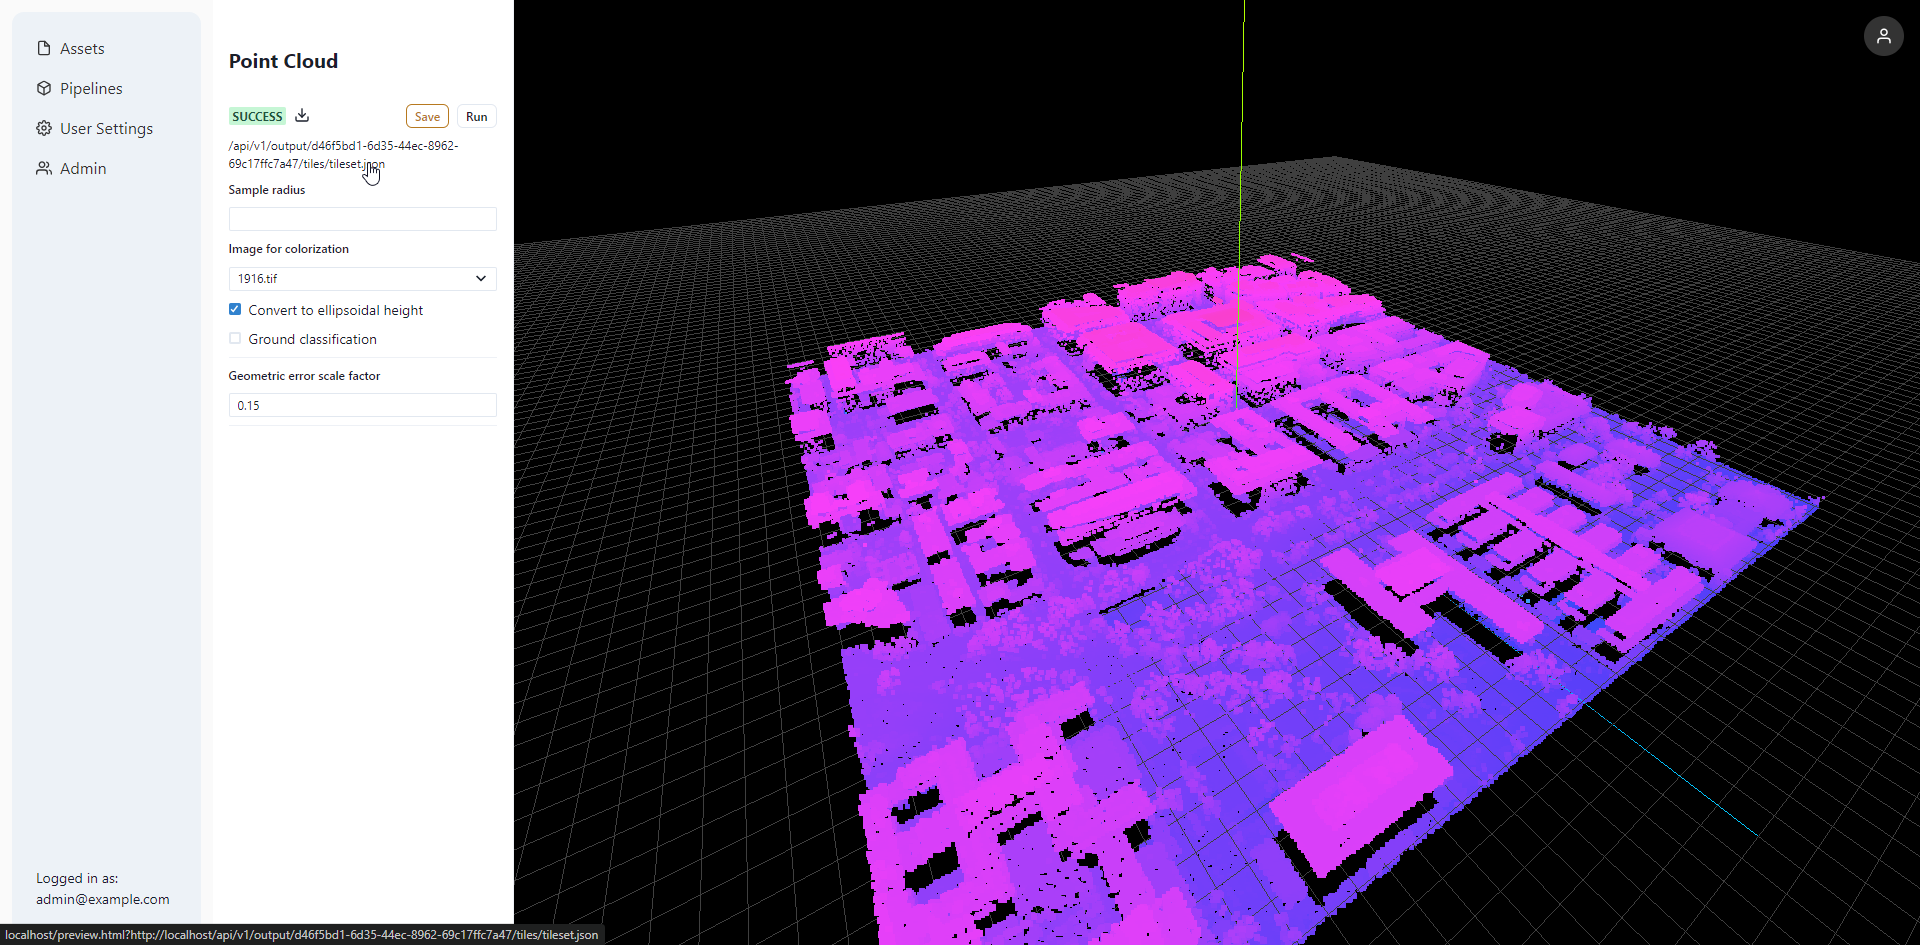
Preview of generated 3D Tiles in Cesium.js by clicking on the tileset link under the SUCCESS status tag.
