Charts
Wiki ▸ Documentation ▸ Charts
Use the chart builders to easily and expressively create impressive charts.
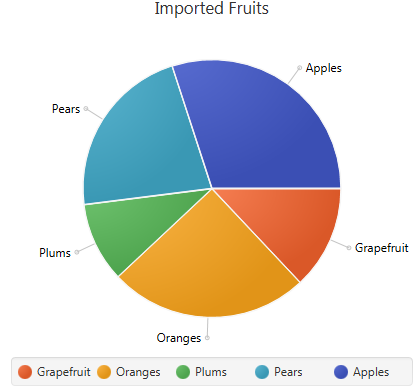
Although the PieChart uses a different data type than the rest of the XY based charts, TornadoFX provides a uniform interface to create them.
piechart("Imported Fruits") {
    data("Grapefruit", 12.0)
    data("Oranges", 25.0)
    data("Plums", 10.0)
    data("Pears", 22.0)
    data("Apples", 30.0)
}
The PieChart builder is initialized with a title before the data points are added
The other charts are created in much the same way, but they support multiple series and accepts two Axis instances in the constructor. The following example illustrate usage for BarChart, StackedBarChart, LineChart, AreaChart and BubbleChart:
barchart("Stock Monitoring, 2010", CategoryAxis(), NumberAxis()) {
    series("Portfolio 1") {
        data("Jan", 23)
        data("Feb", 14)
        data("Mar", 15)
    }
    series("Portfolio 2") {
        data("Jan", 11)
        data("Feb", 19)
        data("Mar", 27)
    }
}
Note: For BubbleChart and some other chart types, the extraValue parameter in the data() function can be utilized.
There is a special abstraction available to create multiple series more easily. The example above can also be expressed like this:
multiseries("Portfolio 1", "Portfolio 2") {
    data("Jan", 23, 10)
    data("Feb", 14, 5)
    data("Mar", 15, 8)
}
The MultiSeries object is returned so you can add more data at a later time. It also exposes a list of the underlying Series for further manipulation if needed.
If your chart data is in a Map they can be added to a chart directly:
val fruits = mapOf(
    "Grapefruit" to 12.0,
    "Oranges" to 25.0,
    "Plums" to 10.0,
    "Pears" to 22.0,
    "Apples" to 30.0
)

piechart(title) { data(fruits) }
Next: OSGi