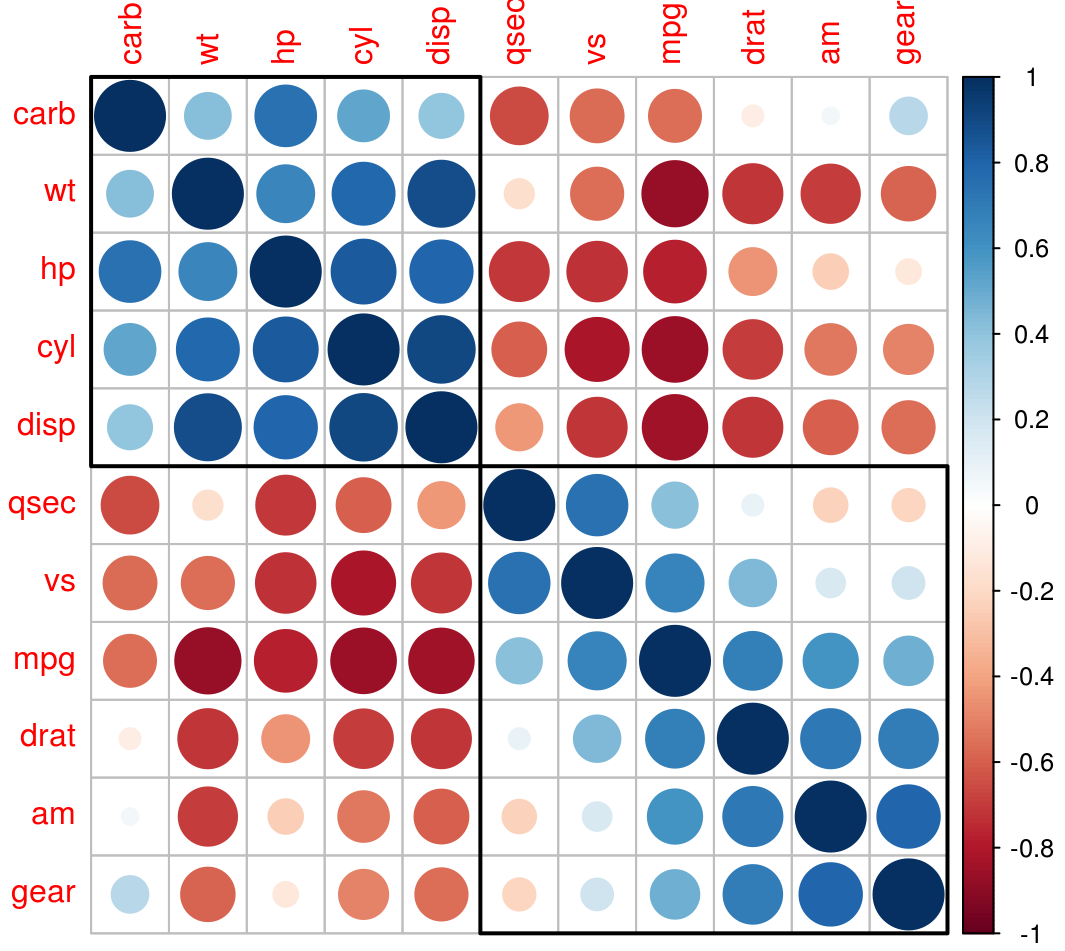
The R package corrplot is for visualizing correlation matrices and confidence intervals. It also contains some algorithms to do matrix reordering. For examples, see its vignette.
This package is licensed under the MIT license, and available on CRAN: http://cran.r-project.org/package=corrplot.
The R core development team and the very active community of package authors
have invested a lot of time and effort in creating R as it is today. Please give
credit where credit is due and cite R and R packages when you use them for data
analysis. To cite corrplot properly, call the R built-in command
citation("corrplot") as follows:
library(corrplot)
citation("corrplot")library(corrplot)
M <- cor(mtcars)
corrplot(M, order = "hclust", addrect = 2)To download the development version of the package, type the following at the R command line:
install.packages("devtools")
devtools::install_github("taiyun/corrplot", build_vignettes = TRUE)
To download the release version of the package on CRAN, type the following at the R command line:
install.packages("corrplot")- Fork, clone, edit, commit, push, create pull request
- Use RStudio
- Unit-testing: press
CTRL+SHIFT+Tin RStudio- we know that is hard to write tests especially for a visual package like this
If you encounter a clear bug, please file a minimal reproducible example on github.
We use lintr which also performs the analysis on Travis-CI.
Configuration for lintr is in .lintr file.
Lints are treated as warnings, but we strive to be lint-free.
In RStudio, you can run lintr from the console as follows:
> lintr::lint_package()This package is free and open source software, licensed under MIT.
- Corrplot listed at OpenHub: https://www.openhub.net/p/corrplot
- Research software impact of Corrplot (by Depsy): http://depsy.org/package/r/corrplot
- CRAN: http://cran.r-project.org/web/packages/corrplot
In order to develop the corrplot package, you might want to install the following dependencies on Ubuntu-based systems. These are mostly needed for generating the vignette.
sudo apt-get install libxml2-dev
sudo apt-get install libcurl4-openssl-dev
sudo apt-get install texlive-latex-base
sudo apt-get install texlive-latex-extra
sudo apt-get install texlive-fonts-recommended
sudo apt-get install texlive-extra-utils
sudo apt-get install librsvg2-bin
sudo apt-get install libmagick++-devinstall.packages("lintr")
install.packages("testthat")
install.packages("roxygen2")
install.packages("magick")
install.packages("base64enc")
install.packages("rmarkdown")
install.packages("tinytex")
