Home
The Smooth app is designed to provide an optimized path of travel in San Francisco. When plotting a route, users will be able to rank their priorities for the journey to choose a safe, efficient path with low changes in elevation.
When planning a trip with a service such as Google Maps, pedestrians and bikers may unwittingly travel across steep hills or through unsafe neighborhoods. By assigning a safety score to each intersection and calculating the change in altitude over each road, Smooth is designed to avoid undesirable areas and make travel more safe and pleasant for its users.
At minimum, the app will satisfy the following criteria with adequate styling and smooth, bug-free navigation:
- Ability to map optimized route based on safety
- Ability to map optimized route based on changes in elevation
- Option to set route preferences
- Users given the ability to open a third-party transportation service
- Demo website showcasing relevant app features
- Production README
- Incorporate option for scenic travel
- Custom live travel view instead of opening Google Maps
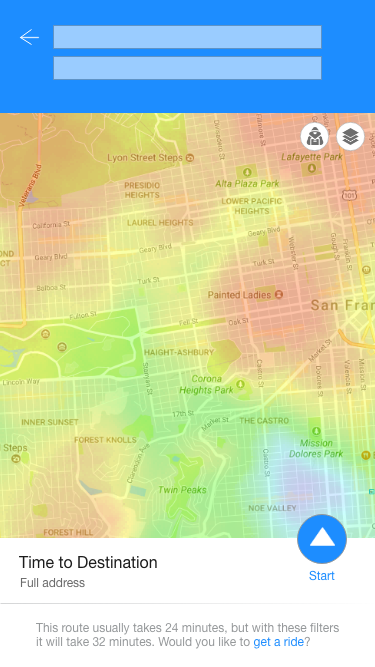
- Allow users to toggle a heat map of crime along their route
- Add data from crime statistics to avoid specific areas based on time of day
- Transition to MERN stack
The app will provide the following custom views:
- Loading Screen: The loading screen will be displayed as the app loads.
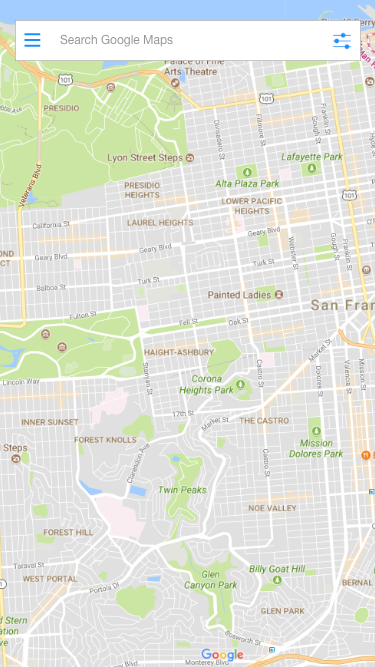
- Home Screen: From the home screen, users can toggle a menu, enter an address, or select route preferences.
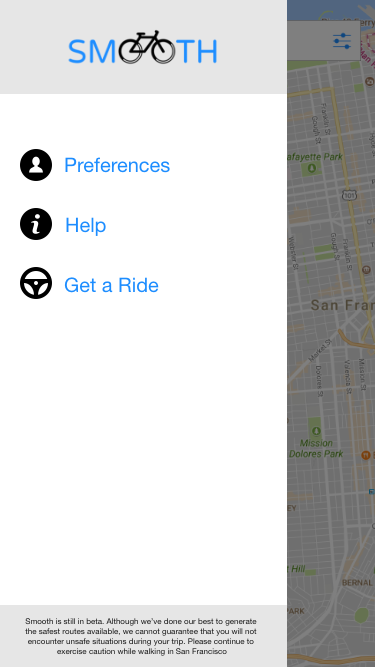
- Menu: On the menu, users can set their default route options, get help using the app, or call for a ride using Uber or Lyft.
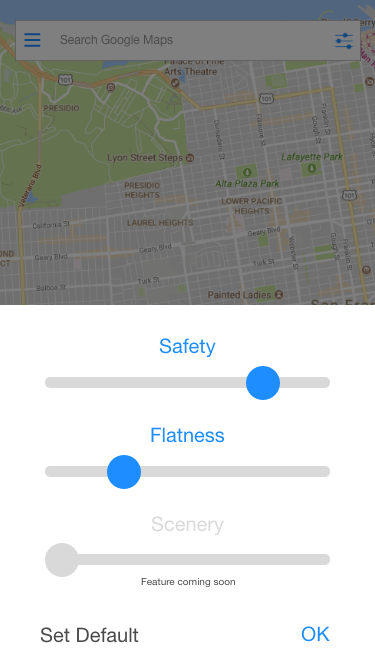
- Route Options: From the route options component, users move sliders to weight their preferences for their route. They can also save the current configuration as a default for future trips.
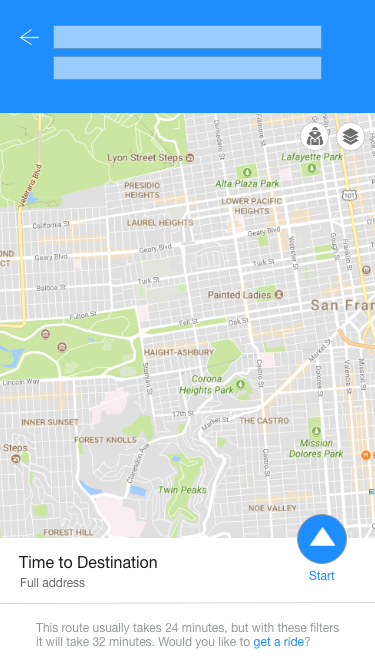
- Route: Once users have chosen their destination, they will be given an overview of their route, with time to destination and a custom message. From there, they can click on 'start' to be taken to Google Maps for live routing. They can click on the link in the custom message to get a ride.
- Crime Heat Map (Bonus Feature): Utilizing our precompiled crime data, users can view a heat map of criminal activity along their route.
This application will be built on Rails using React Native, utilizing precompiled data to determine an optimized route. The following is a summary of the technologies used in the app, along with their specific uses in our application:
-
React Native: This framework allows developers to build mobile apps using only JavaScript. This is perfect for Smooth, since the use case for our app is primarily on mobile. It also allows us to prototype quickly and iterate on our designs, with live updates on each of our teams' mobile devices.
-
Road Network API: Daniel Fletcher's Road Network API contains data that treats every intersection within San Francisco as a node, with paths between them represented as lines with the corresponding node IDs. Our team will add the additional data points of elevation change and a safety rating to each path. The app will determine user preferences to weight the relative importance of safety and a flat route. Utilizing a variation of Dijkstra's single-source, shortest path algorithm, an optimum route will be determined and return a set of waypoints along its path.
-
Google Maps API: The Google Maps API was used to retrieve altitude data for each node based on latitude and longitude. We will also make a request to this API for each requested route, passing it the set of waypoints returned by our algorithm. This returns an ordered set of points along the route, which will be used to draw the route on our map with polylines.
- Extrapolating crime data to the paths in a useful and meaningful way
- Setting parameters for the algorithm which return a realistic path and limited number of waypoints
- Drawing a path on our map using points returned from the Google Maps API
Saturday: We set up our React Native app, and educated ourselves on using this new technology. We also familiarized ourselves with the various APIs we are using to create our app. We created the wireframe and loading screen. We began compiling elevation and crime data, and parsed it based on relevance to our app. We determined the data structure of our database.
Sunday: We added a map to our app and continued to educate ourselves on React Native. We made final decisions regarding the stack we will use for our project, and researched these new technologies to familiarize ourselves with them. We also drafted our proposal.
Our group has three members: Alvin, Dillon, and Trevor. The following is a list of their primary responsibilities on the Smooth app:
- Owning the backend of the app and setting up the MVCs
- Parsing the crime data and extrapolating it to the nodes
- Responsibility for understanding and implementing the Google Maps API
- Owning usage of the backend data and structuring the database
- Responsibility for parsing altitude data and adding it to the nodes
- Connecting the backend algorithms to the frontend
- Owning design of the app, as well as frontend components and React Native
- Mapping the routes with polylines and react-native-maps
- Designing and building the app's website, and finalizing the README
- Understanding and implementing Dijkstra's algorithm for finding routes
- Determining the optimum multipliers for weighting user preferences against paths
- Setup Rails backend
- Incorporate test data and ensure functionality
- Render a basic home page on the app
- Finish pre-compiling data with all factors included (elevation delta and safety rating)
- Add data to backend
- Make final determinations regarding the algorithm based on data structure
- Find and implement a JavaScript version of Dijkstra's algorithm
- Modify the algorithm to account for user preference multipliers
- Demonstrate functionality of algorithm by returning multiple routes through known areas
- Create route options menu and connect it to algorithm
- Implement usage of the Google Maps API
- Create React components for every custom view
- Implement route drawing feature
- Integrate third party services for calling a car
- Review design and optimize appearance/usability
- Create production README
- Create website for app
- Work on bonus features with remaining time