R (dplyr package), RStudio
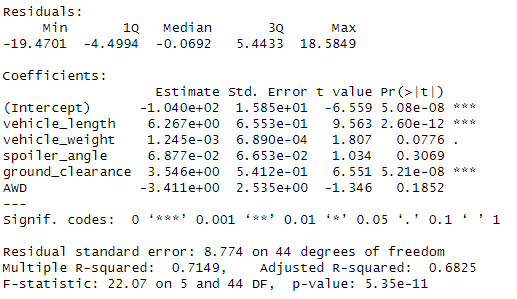
Multiple linear regression was performed on a dataset containing "vehicle_length", "vehicle_weight", "spoiler_angle", "ground_clearance", "AWD" (drivetrain), and "mpg" (miles per gallon). This was done to create a model that predicts the MPG of MechaCar prototypes using the first 5 variables.
- Each Pr(>|t|) value of the variables represents the probability that each variable contributes a random amount of variance to the model. That means the lower the number, the more statistically significant. Vehicle length (0.00000000000260) and ground clearance (0.0000000521) therefore have a significant impact on MPG.
- The slope of this model is not 0, as the p-value of the model is 5.35e-11 (or 0.0000000000535). This is a whole lot smaller than a standard assumed significance level of 0.05%.
- In my opinion, this model should currently not be relied on to effectively predict MPG. The intercept is very statistically significant at 5.08e-08 (0.0000000508), meaning that there are variables/factors not included in the model that contribute to the MPG. Vehicle weight COULD be considered significant at 0.0776, but vehicle length and ground clearance are overwhelmingly significant variables compared to the other 3. This model could be improved using different data that contributes a lot more to an accurate prediction.

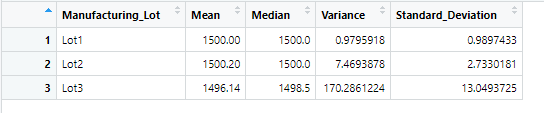
The summarize() and group_by() functions were performed on a dataset containing "Vehicle_ID", "Manufacturing_Lot", and "PSI" (pounds per square inch) for suspension coils of different vehicles. This was to create two dataframes, one showing statistics of the PSI column in entirety, and one showing those statistics by manufacturing lot.
- All lots do not meet the requirements of the variance of the suspension coils not exceeding 100 pounds per square inch. Lot 1 and 2 comply, but Lot 3 exceeds this at a rounded variance of 170.
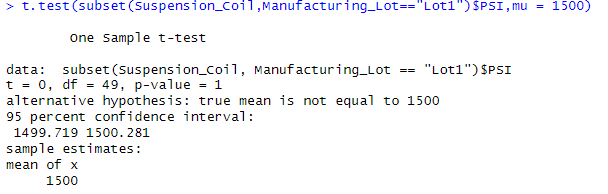
AskBCS was used on the "t.test(subset(Suspension_Coil,Manufacturing_Lot=="Lot1")$PSI,mu = 1500)" subset code.
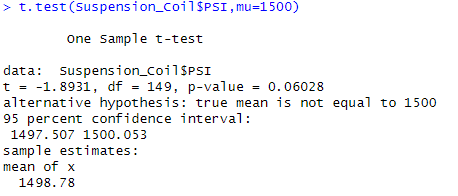
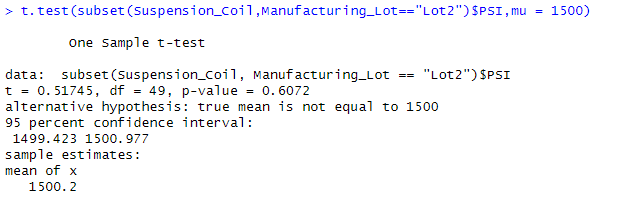
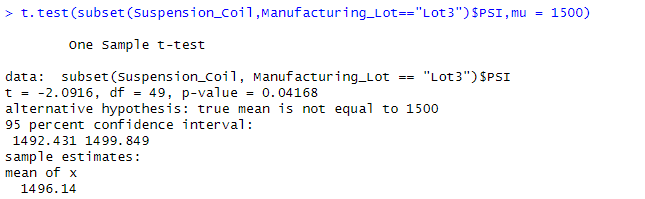
One sample t-Tests were performed on the same suspension coil dataset to compare the PSI of the manufacturing lots against the population mean of 1,500.
- Assuming a significance level of 0.05% for the p-value, as a whole, all the manufacturing lots (0.06028) share a statistically similar mean to 1,500. Lot 1 is exactly the same with a p-value of 1, Lot 2 is statistically significant with a p-value of 0.6072, and Lot 3 is dissimilar with a p-value of 0.04168 and therefore represents an irregularity compared to the other two lots.
Many metrics are important to consumers. Cost, city or highway fuel efficiency, horse power, maintenance cost, and safety rating all matter to consumers in different ways and should all be considered in manufacturing a quality vehicle and comparing MechaCar to models to the competition.
- Therefore, the metrics for testing should match these concerns. Personally, in a vehicle, my main concerns are the cost, fuel efficiency, maintenance cost, and safety rating. Vehicles that are too expensive to buy and maintain compared to their worth/use are of little value to me. Additionally, it's nice to know that the great metal death machine I'm piloting on public roads is safe to use. So if there was going to be another test run, I would choose these variables.
- If comparing MechaCar vs other manufacturers, an alternative hypothesis can be that the cost, fuel efficiency, average maintenance cost, and safety rating of MechaCar models is better than others.
- I would use a two-sample t-Test to compare these metrics with certain types of vehicles. MechaCar compact vs competitor compact, MechaCar SUV vs competitor SUV, MechaCar truck vs competitor truck, and so on. Different vehicles cost more, run differently, and have different levels of use, so I believe that staying within the same general design elements would help make the tests more accurate. Average cost, average fuel efficiency, average yearly/bi-yearly (however often people get maintenance varies, so this is just a broad suggestion) maintenance cost, and safety rating would be compared between MechaCar and either a specific competitor, or several compiled into one "Competitor" dataset. For example, if MechaCar SUVS average $27,000, let this be compared to a competitor average SUV cost of $30,000.
- The data needed for this statistical test is therefore similar to what I described previously. Data would be needed for cost, fuel efficiency, maintenance cost, and safety rating for different model types of MechaCar and competitor vehicles. Perhaps compared against 3 top competitors individually, or all together. It would be interesting to see how financial value (cost, average maintenance costs) compares with technical value and reliability (fuel efficiency, safety rating). Would competitors have more or less "value" for their cost? What manufacturers value performance over affordability, and vice versa? What manufacturers strive to achieve afforability and performance together?