Skip to content

JavaScript/Leaflet used to create map visualizations on earthquake data around the world, focused specifically on the Californian west coast of the United States

Notifications You must be signed in to change notification settings

swilli73/Mapping_Earthquakes_

Repository files navigation

Mapping_Earthquakes_

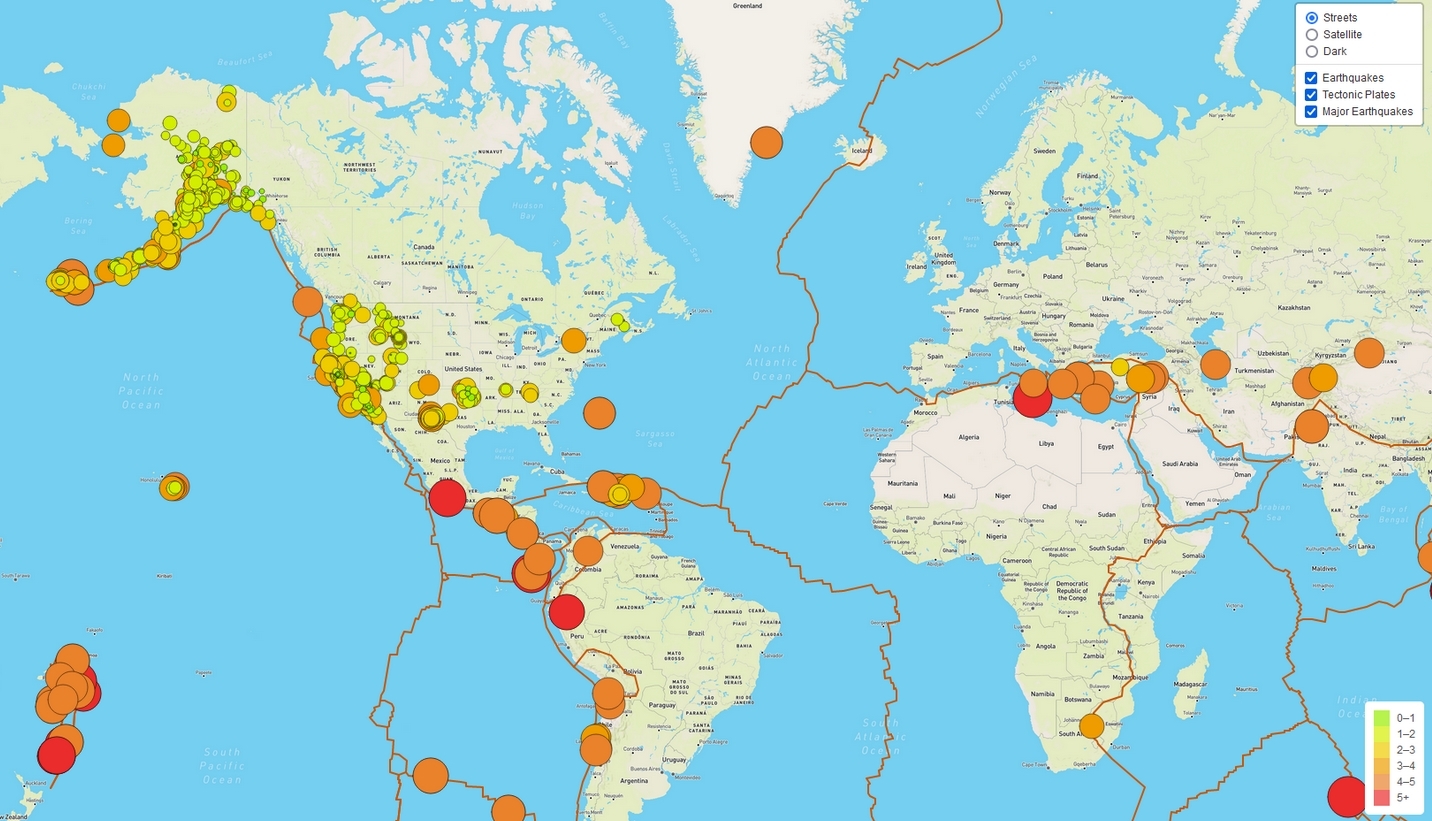
Javascript, Leaflet, VS Code, and Git Bash were used to create map visualizations on earthquake data around the world, focused specifically on the Californian west coast of the United States.


For purposes of the challenge code, all resources used were from official Leaflet documentation, class module examples, and https://htmlcolorcodes.com/color-picker/ for color hex codes.

Earthquake/tectonic plate API data taken from https://earthquake.usgs.gov as well as GEOJson data from https://github.com/fraxen/tectonicplates/tree/master/GeoJSON.


map

About

JavaScript/Leaflet used to create map visualizations on earthquake data around the world, focused specifically on the Californian west coast of the United States

Topics

Resources

Stars

Watchers

Forks

Releases

No releases published

Packages

No packages published