Data comparison and inspection charts
- General options
- Data comparison and inspections charts
- General information
- Comparison level
- Peptide counting
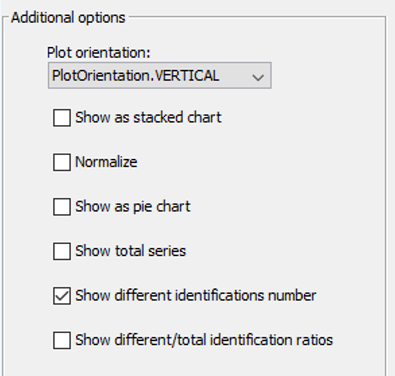
- Chart additonal options
- Chart customization
In this window you will be able to inspect the datasets included in the project that is loaded. You will have multiple charts available and multiple filters to apply. However, before that, a dialog will appear with the following options to choose from:
Once the user defines / loads the comparison project and then clicks on 'Save project and Finish' button, a new dialog is shown.
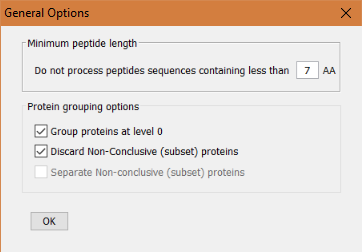
In this dialog the user will be able to select some options such as:
- The minimum peptide sequence length that will be considered in the analysis. Any peptide below that threahold will be ignored. (Note that peptides discarded by this option will not be able to be recovered by a more relaxed subsequent peptide length filter).
-
Protein grouping options
- Group proteins at level 0: Whether the protein grouping algorithm, PAnalyzer, is also applied at level 0 or not. If this option is selected, the proteins (protein groups) shown in the level 0, will be resulting from the regrouping of all peptides in the comparison project. However, if this option is not selected, level 0 will collect, but not regroup, all the protein groups coming from the level 1 nodes of the project.
- Discard Non-Conclusive (subset) proteins: If this option is enabled, the non conclusive proteins (according to PAnalyzer classification), that is, proteins having all their peptides shared by other proteins being a subset of those proteins, will be ignored.
-
Separate Non-Conclusive (subset) proteins:
- If this option is enabled, the non-conclusive proteins (or subset proteins) will form an independent protein group (with one single protein).
- If this option is disabled, the non-conclusive proteins (or subset proteins) will be included in all the other groups that share at least one peptide with them.
Note that if this option is disabled, subset proteins are going to be present in more than one group, which could lead to non expected results when creating overlapping charts with the option of 'share any protein'
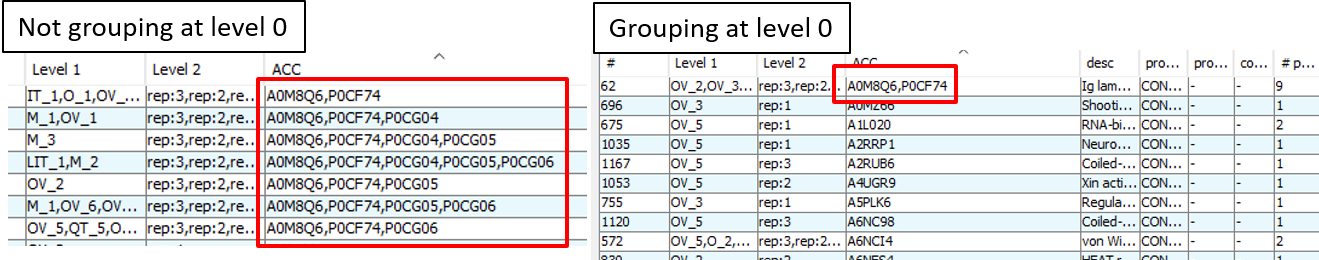
For a better understanding of the 'Group proteins at level 0' option, lets look to an example. In the next figure, you can see the difference between selecting the option or not. At the left you can see how by not selecting the grouping at level 0 we see that similar protein groups are present in the aggregated total dataset of the project. However, when we enable the grouping at level 0, we can see at the right how the proteins get rearranged and only one group containing the protein A0M8Q6 is present. The rest of the proteins where regrouped into different groups down in the list.
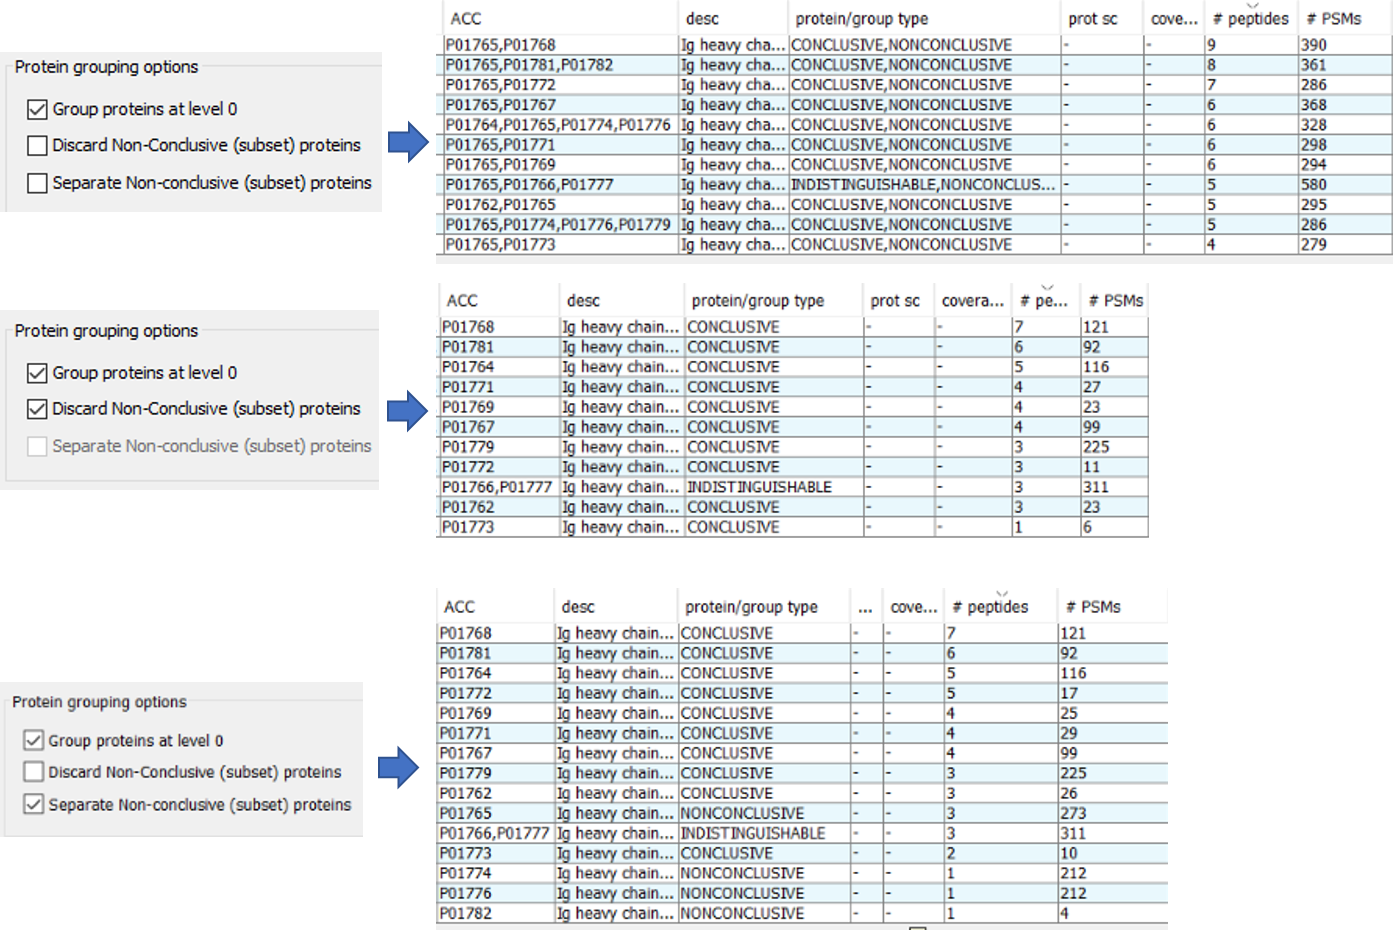
For a better understanding of the other 2 options about the Non-Conclusive proteins, we can observe the following screenshot in which a set of proteins are filtered to show how PACOM behaves depending on the selected option.
- As you can see, in the first configuration (do not discard Non-Conclusive proteins and do not separate them), the protein P01765, a Non-Conclusive protein, is present in all the 11 groups, because it shares peptides with at least one protein of the other members of the groups.
- In the second configuration (discard Non-conclusive proteins), the Non-Conclusive protein P01765 has been ignored in the analysis.
- In the third configuration (do not discard Non-Conclusive proteins and separated them), the protein P01765 is a new entry as protein group with just one member. Other Non-Conclusive proteins such as P01773, P01774, P01776 and P01782 are also in different rows, counting as different proteins. In this case we have 15 protein groups.
As you have seen in the previous example, depending on the option you select, the number of proteins (in fact protein groups) changes. Depending on the purpose of your comparison you may want to select some options or others. Here are some recomendations:
- If you care about proteoforms, do not discard non-conclusive proteins.
- If you want to see overlappings of proteins between different datasets, you may choose either to discard non-conclusive proteins, to separate Non-Conclusive proteins, or to select a different option than 'share any protein' in order to make overlapping comparisons more stable.
- If you select to separate Non-Conclusive proteins, take into account that an overcounting may be occurring since the number of proteins reported are going to count them, and they may be or may not really be in the samples (there is not enough evidence of their existence). Indistinguisable proteins (proteins that share ALL their peptides) are only counted once anyway (regardless of this options).
After closing the 'General options' dialog, the user will go to the 'Chart Viewer' window:
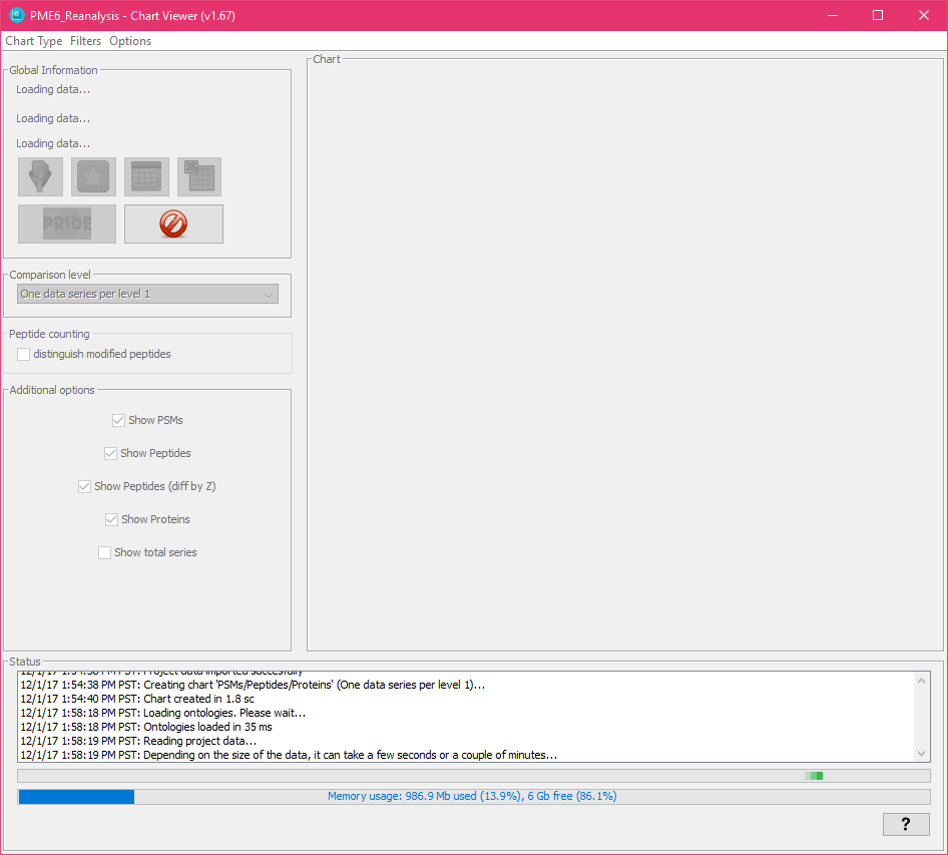
The tool now is reading all the datasets included in the comparison project. This can take some seconds, depending on the size of the datasets.
After the comparison project is loaded, the PSM / Peptides / Peptides (diff by z) / Proteins chart will appear by default.
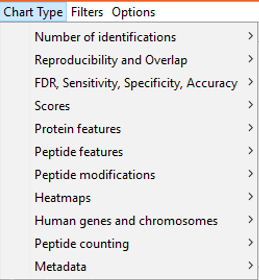
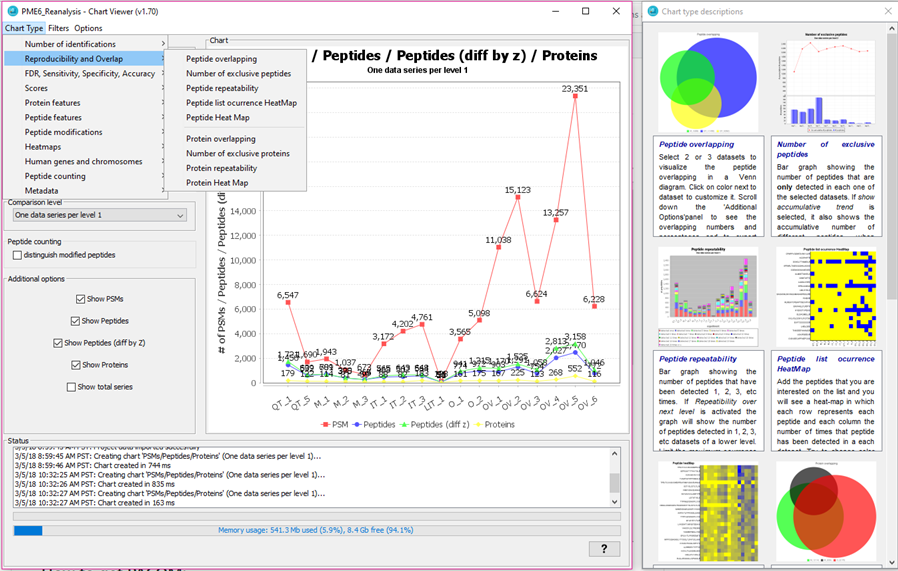
The first time the user uses the tool, it may feel a little bit lost here. What to do now? For that, we have developed a new interactive system to show the user the possibilities at this point. So, you can go to the menu bar at the top and select the 'Chart Type' menu. This will show all the possible charts grouped by different categories:
If you select one of the groups you will see how a right panel appears with a visual example and an explaination for each of the chart types under that chart category.
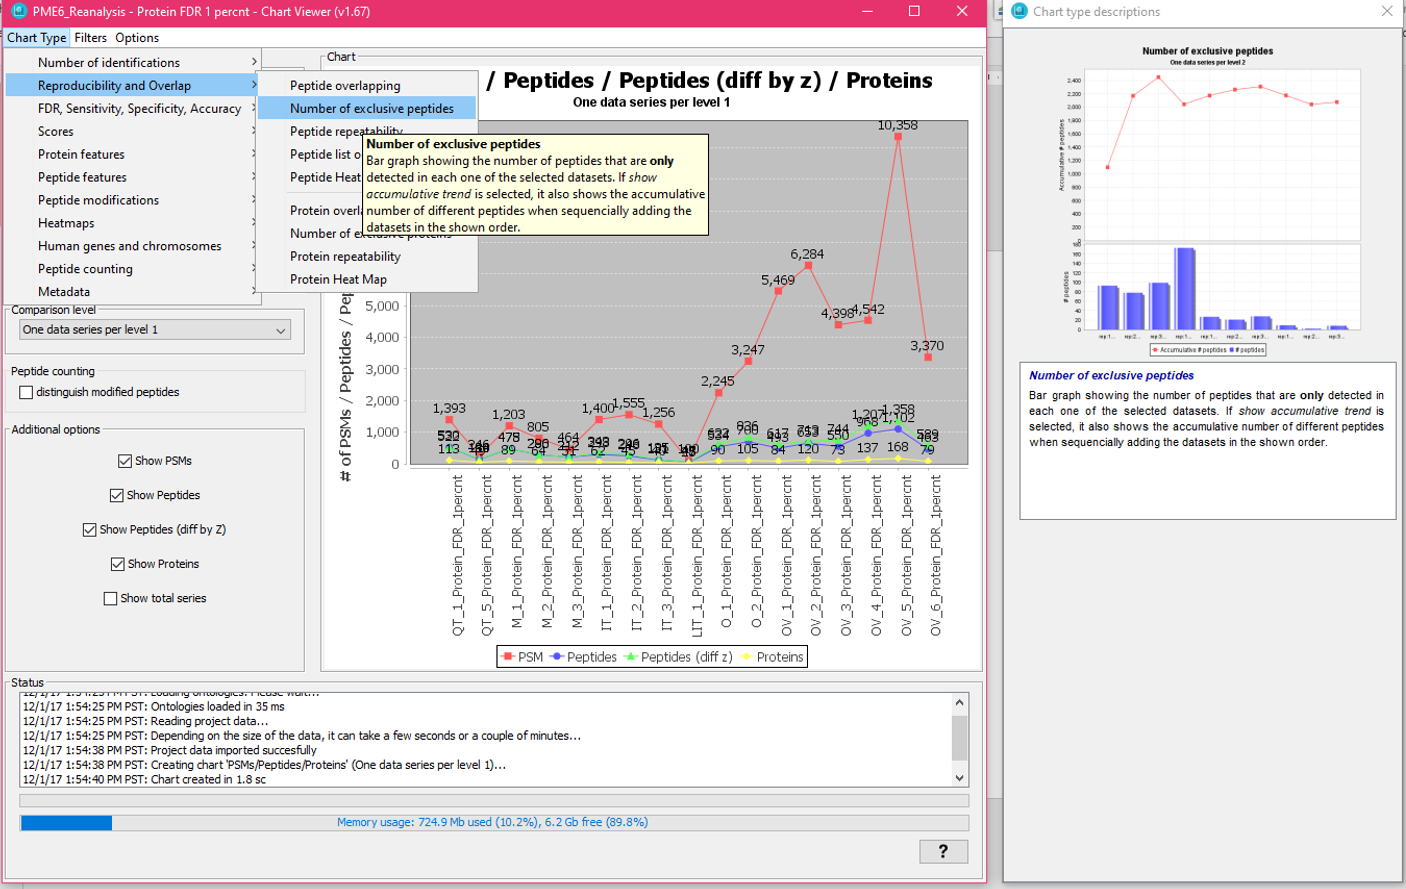
If you select one of the individual charts the right panel will only show the informatioon about that chart type with a bigger image.
The 'Data Comparison and Inspection Charts' view contains several panels:
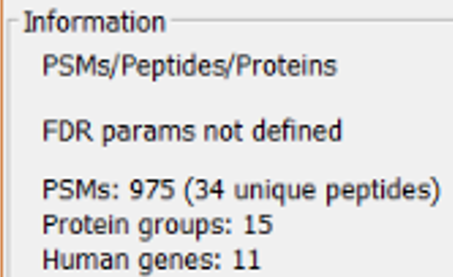
This panel shows general information about the current type of chart, number of proteins and peptides, total FDR, etc. Note that the number of proteins (here and in any other chart) refers to number of protein groups after the application of the PAnalyzer algorithm.
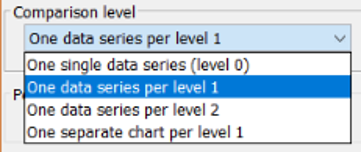
This combo-box, available for most of the chart types allows to compare the data between different levels of aggregation:
- One single data series (level 0): The charts will show a single data series corresponding to the aggregated dataset in the level 0 node.
- One data series per level 1: The charts will show a data series per each one of the level 1 nodes that are present in the comparison project.
- One data series per level 2: The charts will show a data series per each one of the level 2 nodes that are present in the comparison project.
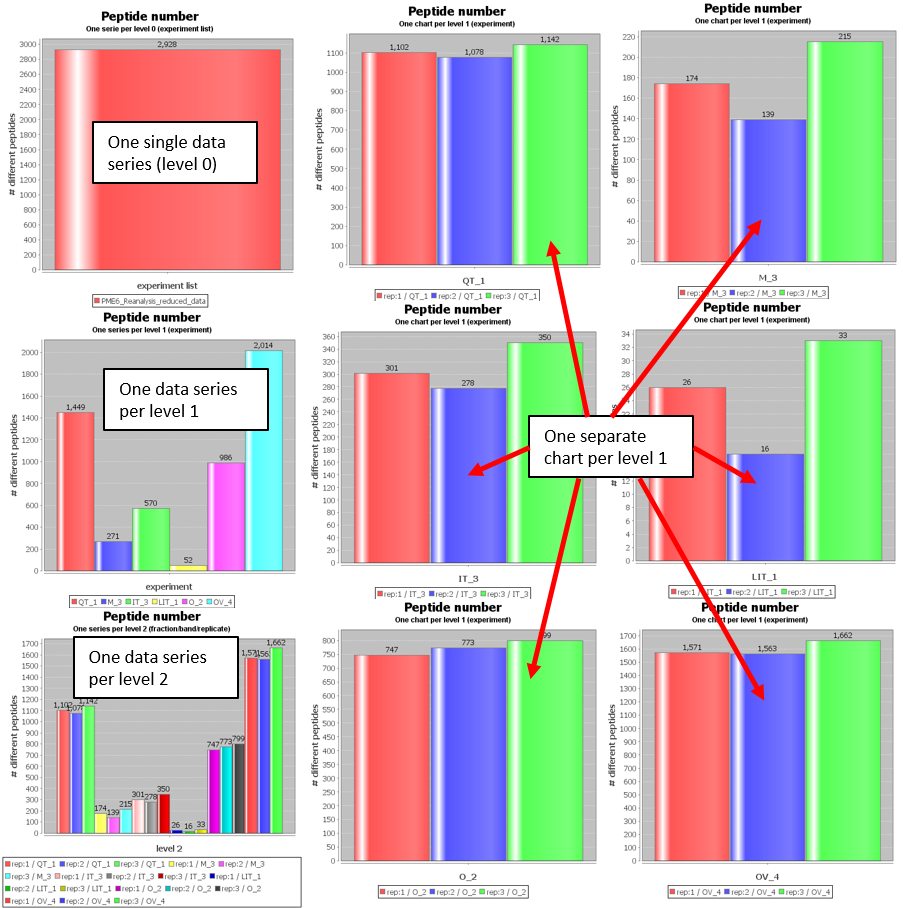
- One separate chart per level 1: PACOM will generate a different chart per level 1 node, each one showing data from its respective level 2 nodes datasets.
As an example, using a comparison project that compares 6 experiments in triplicates, that is, 6 level 1 nodes with 3 level 2 nodes each, we can see in the next figure the difference on selecting the different 'Comparison level' options:
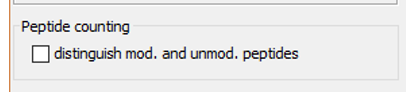
If 'distinguish mod. and unmod. peptides' option is selected, peptides with the same sequence, but containing different PTM, will be considered as different peptides. If it is not enabled, PTMs are not taken into account to differentiate peptides with the same sequence.
This panel shows the different options that usually have each chart type.
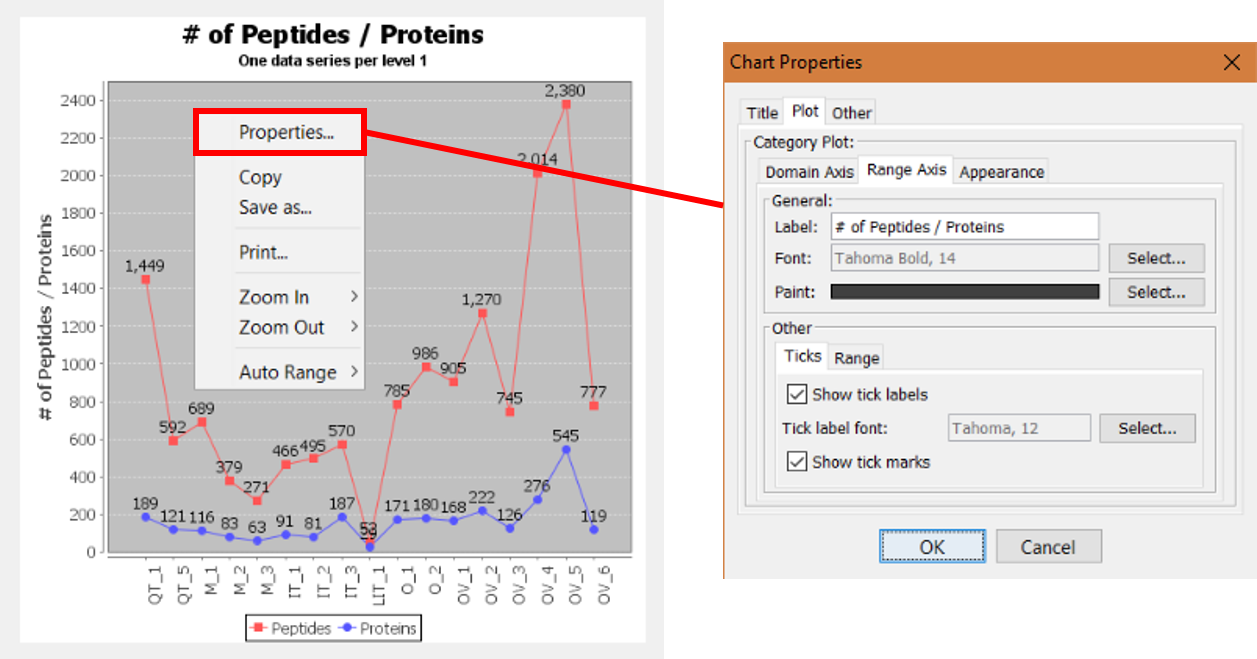
Every chart (except the venn diagrams) is customizable by opening the customization chart menu by right clicking on the surface of the chart. Axis ranges, axis labels, axis ticks, background colors, font type and size, titles...are all customizable: