
import plotify as pl
import numpy as np
# create plot object
plot = pl.ModernPlot(width=7500.0)
# title
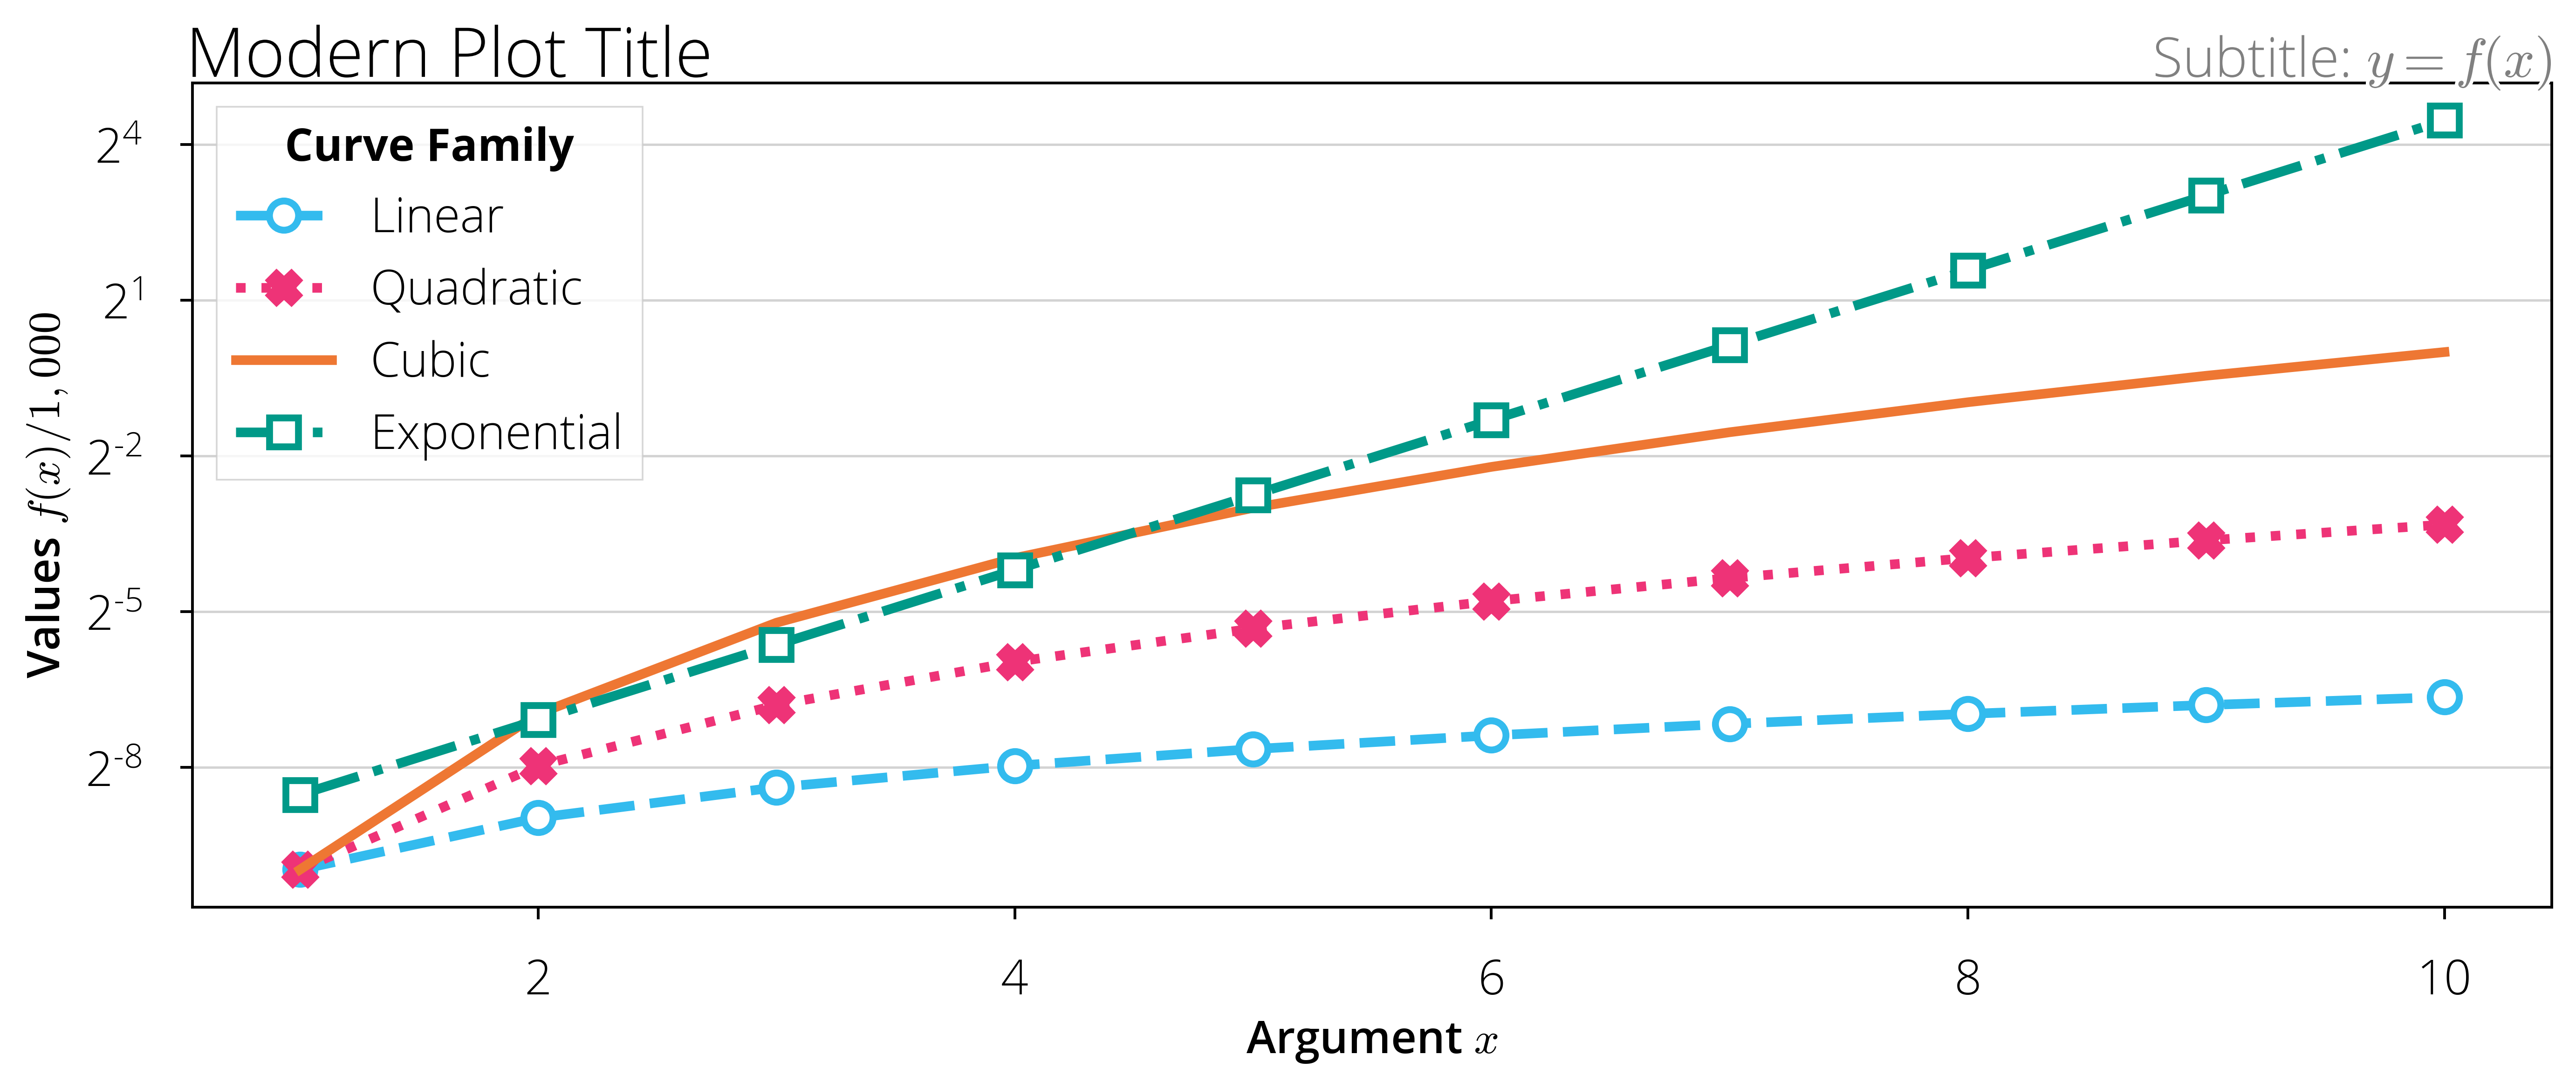
plot.set_title('Modern Plot Title')
plot.set_subtitle(r'Subtitle: $y = f(x)$')
# settings
plot.set_palette('vibrant')
plot.set_axis(x=r'Argument $x$', y=r'Values $f(x) / 1,000$')
plot.set_notation(x='scientific', y='decimal')
plot.set_scales(x='linear', y='log2')
plot.set_grid('horizontal', granularity='coarse')
plot.set_legend(title='Curve Family')
# plot data
num_points = 10
xs = np.arange(1, 1 + num_points)
plot.plot(
x=xs,
y=xs / 1000,
label=r'Linear',
linestyle='dashed',
)
plot.plot(
x=xs,
y=xs**2 / 1000,
label='Quadratic',
linestyle='dotted',
)
plot.plot(
x=xs,
y=xs**3 / 1000,
label='Cubic',
marker=False,
)
plot.plot(
x=xs,
y=np.exp(xs) / 1000,
label='Exponential',
marker=pl.markers.square(size='large'),
linestyle='-.',
)
plot.save('docs/assets/images/examples/modern_plot.png')pip install plotify
- GitHub: github.com/seba-1511/plotify
- Documentation: sebarnold.net/plotify
- Contact: sebarnold.net