Home
Welcome to the iEEGLAB wiki!
- via the extension manager
[to add after release is made]
- via Github download
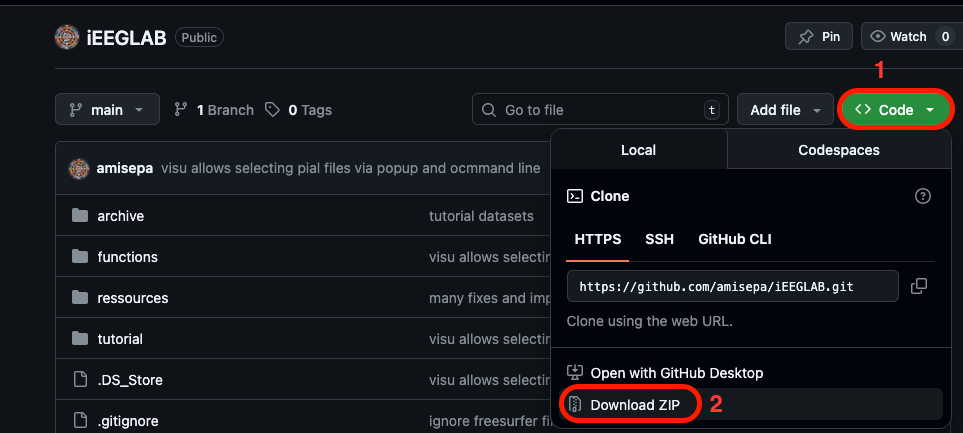
- via Git clone
Navigate to your local eeglab folder (where you installed it) > plugins folder and clone the repo there with:
git clone https://github.com/amisepa/iEEGLAB.git
Note: once the iEEGLAB repository is inside the eeglab>plugins folder, eeglab will add the paths to the plugin and functions automatically when you launch EEGLAB. Otherwise, you can also clone/place the iEEGLAB folder somewhere else on your computer and manually add the path to the folder in MATLAB (if preferred).
Dataset description: This sEEG dataset is subject 2 from this BIDS dataset: https://nemar.org/dataexplorer/detail?dataset_id=ds004696 The dataset in brief, patients were resting in the hospital bed, while single pulse stimulation was performed. The stimulation had a duration of 200 μs, was biphasic and had an amplitude of 6mA. See publication here for more detail on the dataset and the Cortico-cortical evoked potentials (CCEP) methods: https://pmc.ncbi.nlm.nih.gov/articles/PMC10538586/ For tutorial purposes, we:
- removed the first 369 s of data before the experiment started,
- adjusted events timestamps accordingly
- kept only 19 min of experiment data
- downsampled the .mefd dataset from 2048 to 128 Hz
- exported it as an EEGLAB .set dataset
We end up with 16 electrodes and 169 (single-pulse stimulation) events.
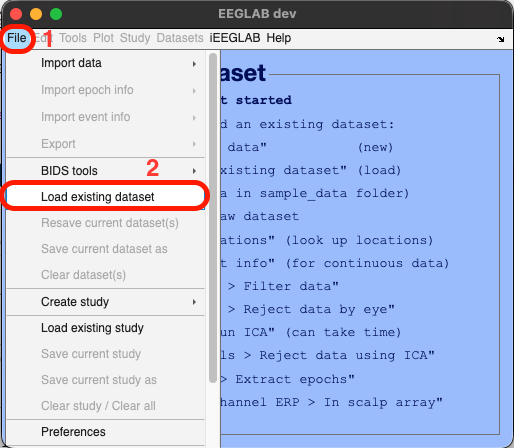
Open MATLAB and open EEGLAB by typing eeglab in your MATLAB command window:
eeglab
Navigate to File > Load existing dataset > navigate to eeglab > plugins > iEEGLAB > tutorial > dataset_seeg > select the file named "sub-02_ses-ieeg01_task-ccep_run-01_ieeg.set" > click open
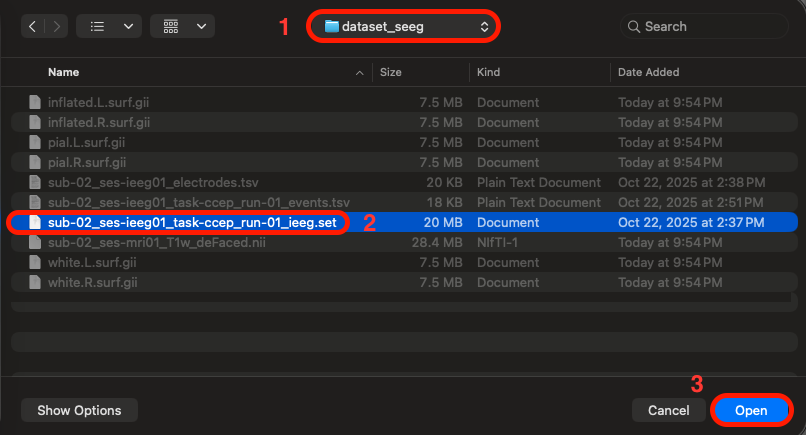
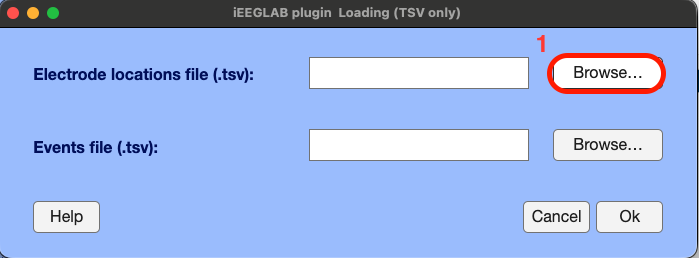
In EEGLAB, go to the iEEGLAB tab > Load electrode coordinates and events
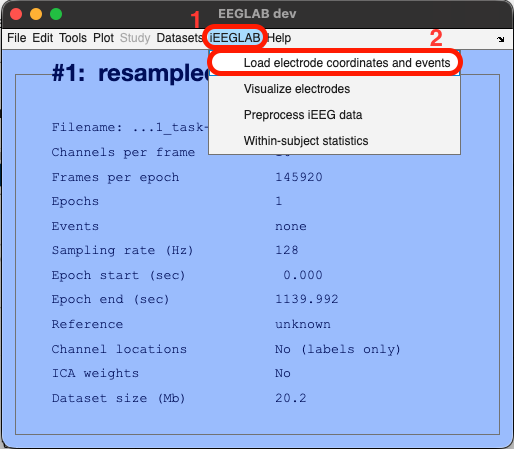
Loading electrodes coordinates is mandatory, whereas loading events is optional (if events are already contained by EEGLAB dataset depending on how the data were collected, or if the application is continuous like epilepsy or medical monitoring).
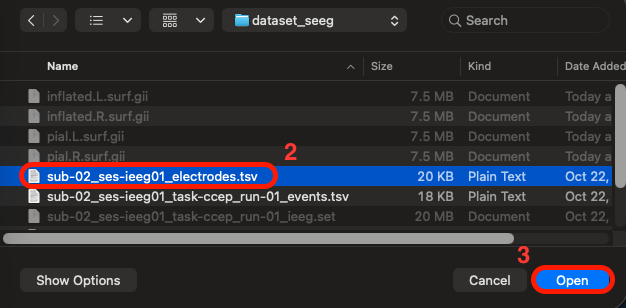
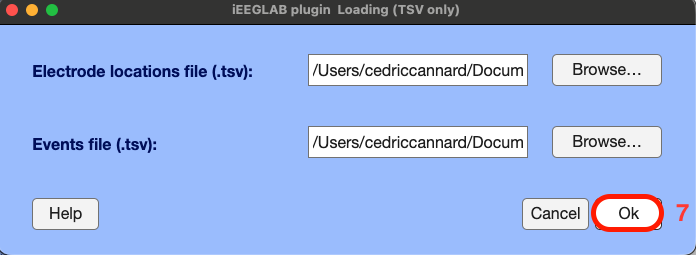
Click the "Browse" button and select the tsv file containing the sEEG electrodes spatial 3D (XYZ) coordinates, named "sub-02_ses-ieeg01_electrodes.tsv" > click "Open"
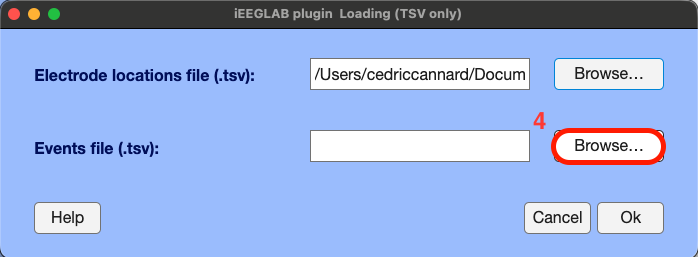
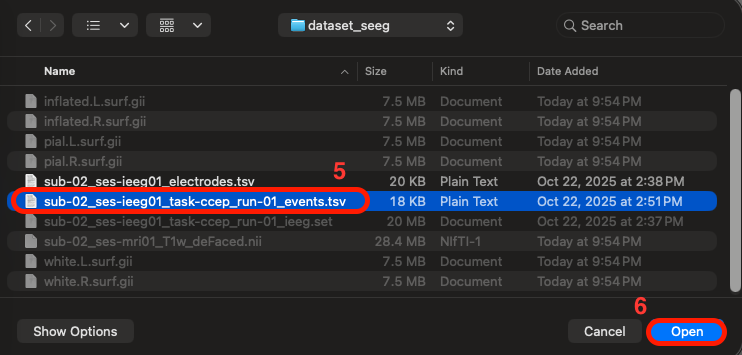
Same for the events, Click "Browse" > select the tsv file containing the event markers, named "sub-02_ses-ieeg01_task-ccep_run-01_events.tsv" > Click "Ok"
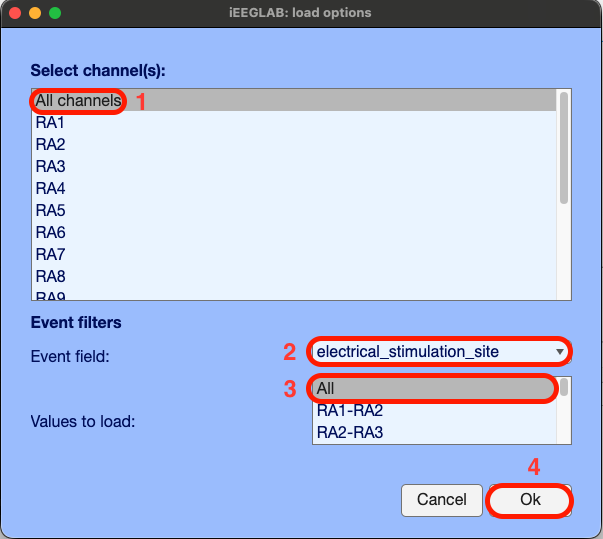
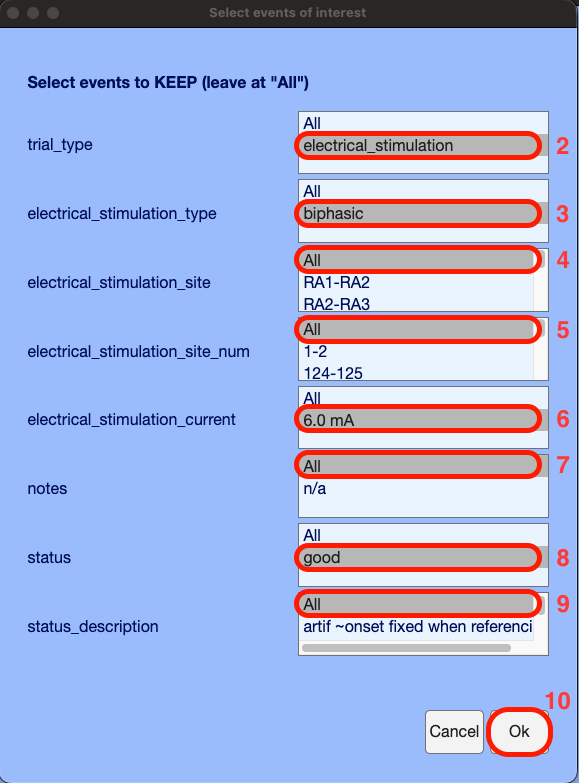
A new EEGLAB interface pops-up automatically to select:
- electrodes of interest (e.g., if you wish to only analyze a few specific electrodes)
- the event field of interest from the .tsv file (by default the code detects the stimulation site by electrode name, but if you wish you can switch to stimulation site by number, or whichever field you may have in your .tsv events file).
- the events of interest (if you wish to only analyze specific conditions/events/stimuli).
Here, we leave the default "All" to include all electrodes and events for subsequent analysis.
And we see the following outputs in MATLAB's command window:
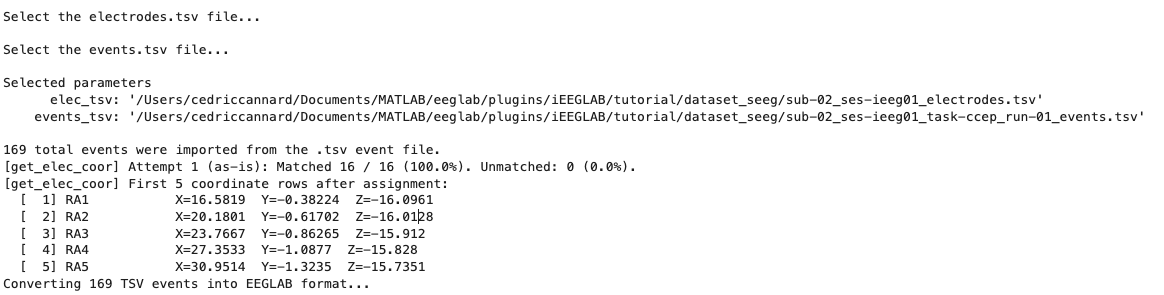
iEEGLAB automatically loaded the electrode XYZ coordinates and events from the two .tsv files, matched the electrode labels to ensure the spatial coordinates match the correct electrode (with 2 fallback methods for best success), runs checks, etc. Here we can see that 100% of electrodes were matched. Note that by default, to make these steps faster and easier, the iEEGLAB plugin will take you to the folder where you loaded the EEGLAB dataset. Also, the plugin supports .csv files, if you do not have these .tsv files. IMPORTANT: if your dataset already contains events (stored in EEG.event after loading the data into EEGLAB), you do not need to select a events.tsv file.
You can launch all these steps via one command line:
EEG = ieeglab_load(EEG);
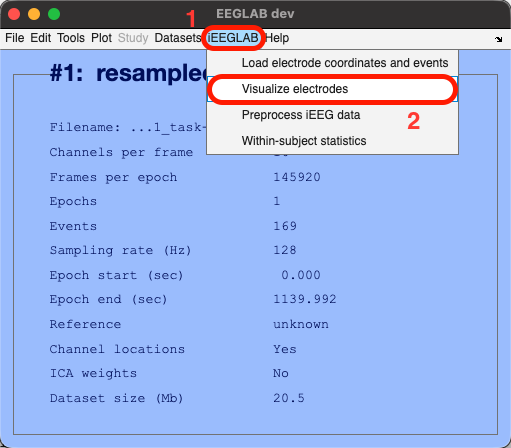
The tutorial dataset comes with the necessary Pial Surface files (one for each hemisphere) generated by Freesurfer from the subject's T1 MRI, we just need to select them from the iEEGLAB interface. How to generate these surface files with Freesurfer is shown later (a process which can take several hours of computation).
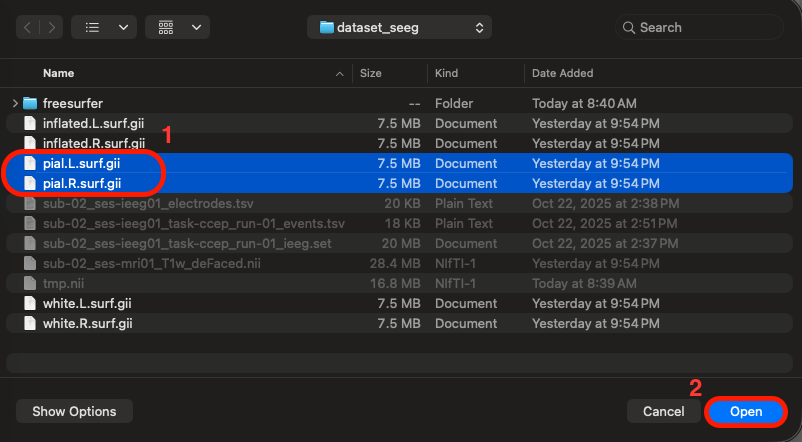
Go to the iEEGLAB tab in EEGLAB > Click on "Visualize electrodes" > Select the two pial.surf files (using the CTRL/COMMAND key to select both; note that "L" and "R" indicate left/right hemispheres, respectively) > Click Open > The glass brain figure appears, showing the 16 sEEG electrode sites located in the right hemisphere.
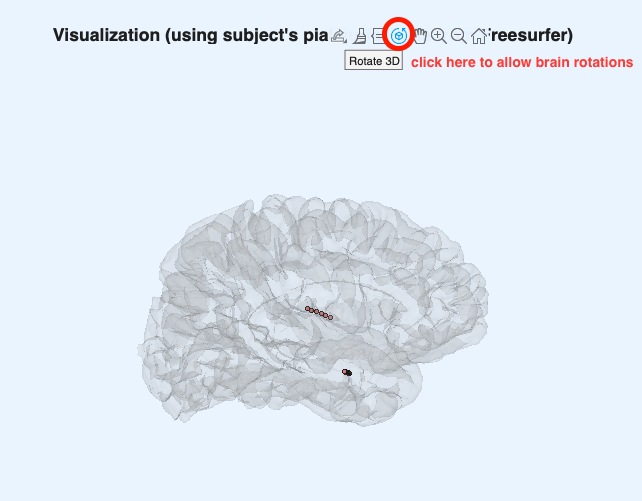
Interactive 3D rotation of the glass brain and electrodes
Launch the visualization via one command line: ieeglab_vis_elec(EEG);
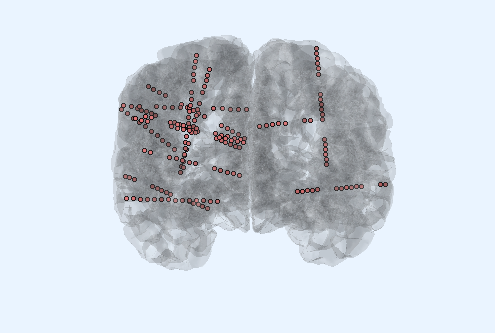
NOTES: this is the reduced dataset for tutorial purposes, but the full dataset has 256 electrodes spread out in both hemispheres. The iEEGLAB plugin only plots one hemisphere if all available electrodes are located in only one hemisphere). This is what the full dataset looks like:
If the surface files are not available, the plugin falls back to dipfit's standard_BEM (smooth) template. This is of course much less accurate as it does not account for individual differences in brain/head size, shape, etc. To generate the surface files via Freesurfer, see sections below.
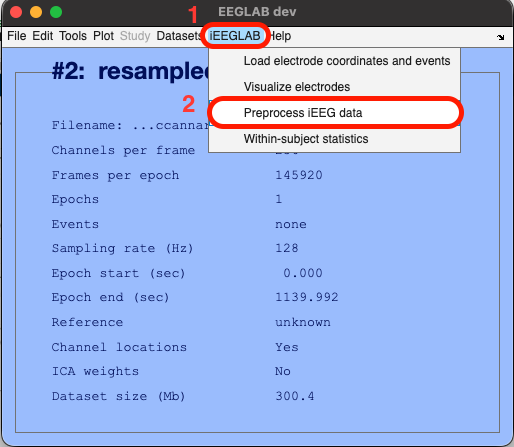
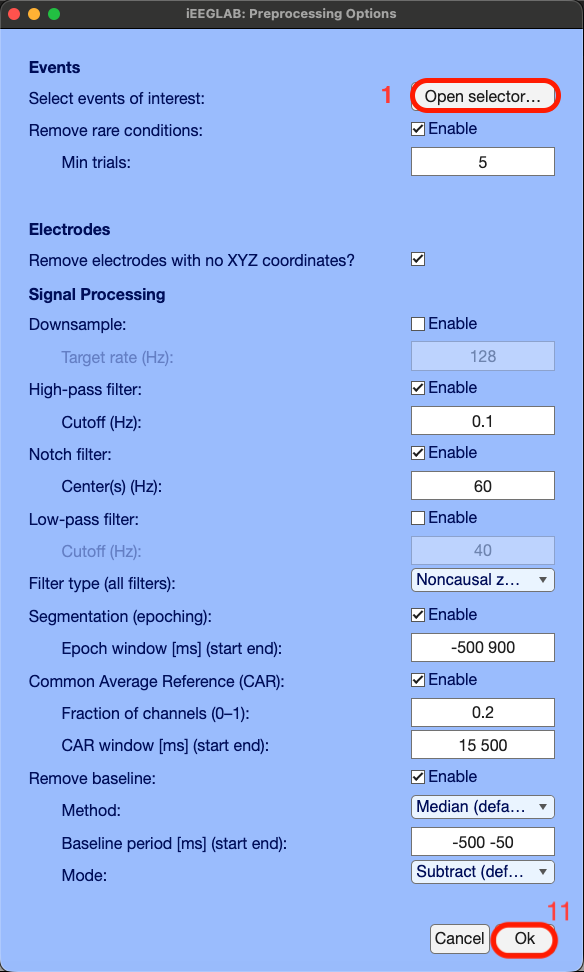
- Navigate again to the iEEGLAB tab > click on "Preprocess iEEG data"
- A new interface pops-up to select some preprocessing parameters.
Usual the default EEGLAB command line: pop_eegplot(EEG,1,1,1);
vis_ieeg_event_data.mp4
Single trials mode:

Also option to do my plot of everything:

Or single trials + trimmed mean (red) of a given electrode:

Quick try of ICA on iEEG data
Times series of the independent components:

ERP of the first 10 components:

7.2. Run within-subject statistics using the Canonical Response Parameterization (CRP) method by Miller et al. (2023)
[in dev]
[in testing]
FreeSurfer (only if you need to generate new brain surface files from subjects' raw T1 MRI data for visualization)
Install XQuartz: https://www.xquartz.org/
Download FreeSurfer from the official site: https://surfer.nmr.mgh.harvard.edu/fswiki/DownloadAndInstall
Installation tips for MAC OS users:
If macOS Gatekeeper blocks the FreeSurfer installer, go to:
System Settings > Privacy & Security > Scroll down until you see something like: ‘freesurfer-macOS-darwin_arm64-7.4.1.pkg’ was blocked because it is not from an identified developer.” 2.3) > Click “Allow Anyway”.

Right-click the .pkg file again > Open > it should now install normally.