Not all visits to a website conclude in an eCommerce transaction. Only a relatively small number of total visits to an e-retail site proceeds to make a transaction. As the company needs to maximize the sales and revenue, they need to analyze the website traffic, which helps the company to make the correct business decisions.
The source of the dataset is Kaggle, https://www.kaggle.com/roshansharma/online-shoppers-intention and consists of feature vectors belonging to 12,330 sessions. Each session belongs to a different user in one year so that there is no pattern concerning user profile, special days or season.

- Removing missing points
- One Hot Encoding the ‘month’ feature.
- Label Encoding ‘weekend’ and ‘revenue’ features
- Outlier Detection and Removal from numerical features
- SelectKBest
- ExtraTreesClassifier
- PCA

Comparing the techniques over F1 score for the XGB and MLP models, Extra Trees Classifier gave the highest accuracy in comparison PCA and Select K-Best. Hence, Extra Trees Classifier was used as the Selection criteria for training and test the models being considered.
- Train_test_split to get a balanced split in the ratio of 80:20
- Normalizing the data after splitting to prevent data leakage using MinMaxScaler
- Logistic Regression
- K-Nearest Neighbors
- Random Forest
- Boosted Trees – XGBoost
- Neural Network – MLP Classifier
- Hybrid Model – Voting Classifier

To experiment and determine the combined probability, we fed all the other 5 models implemented to the voting classifier. This probability was determined using the soft voting type functionality provided by the voting classifier, which gets the average of the weighted probabilities of the individual models. Since we can control the weights given to individual models and hence their importance in the final probability determination, we used Bayesian optimization to determine the optimal combination of weights by optimizing it over the F1 score.

This method is based on building a surrogate probability model in the form of P (Score | Hyperparameters), to get the set of best performing hyper-parameters, by running the optimiser over the iterations with the random values for hyperparameters selected from the range defined.
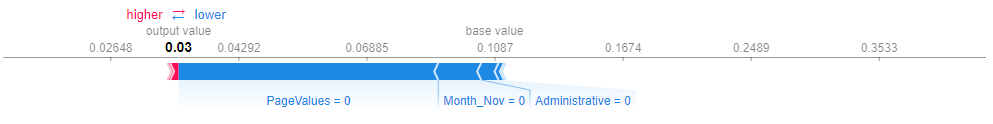 We implemented SHAP on the XGB model using TreeShap and plotted both the local and global interpretation. The shown figure is the local interpretation of a specific data point. In a classification problem, the output value in the figure is log odds and not the prediction, and the base value is the average of all prediction. In the plot, every feature is an arrow that pushes to increase or decrease the prediction. Feature Values can be seen at the bottom. Since the output value is less than the base value, the model has predicted that an eCommerce transaction did not take place.
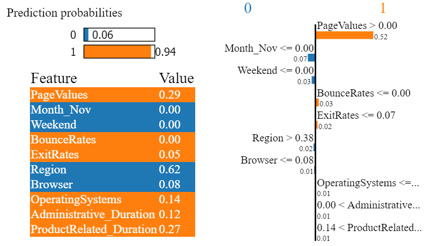
The figure shows the LIME output of a specific datapoint explaining the prediction and contribution of features. The underlying model predicted 1, a successful eCommerce Transaction, with the feature, PageValue, being the driving force behind it. Prediction probabilities per feature and the corresponding values can be seen in the figure as well. For the given data point, the probability for a successful transaction is .94, whereas only 0.06 probability for no transaction.