PandaMap: A Python package for visualizing protein-ligand interactions with 2D ligand structure representation.
Protein AND ligAnd interaction MAPper: A Python package for visualizing protein-ligand interactions with 2D ligand structure representation


Version 4.0.0: First Official Stable Release
PandaMap is a Python package for visualizing protein-ligand interactions with enhanced detection methods.
- Visualization of protein-ligand complexes with 3D-enhanced 2D representations
- Comprehensive interaction detection:
- Hydrogen bonds
- Pi-Pi stacking
- Hydrophobic interactions
- Salt bridges and ionic interactions
- Halogen bonds
- Metal coordination
- And many more!
- Realistic solvent accessibility calculation
- Support for multiple input formats (PDB, CIF, PDBQT)
- Detailed interaction reports
pip install pandamapStarting with version 4.0.0, PandaMap is now in stable release status. We follow semantic versioning and maintain backward compatibility within the 4.x series.
This version marks the first official stable release of PandaMap. After extensive development and refinement through earlier versions, PandaMap 4.0.0 provides a complete, stable API for visualizing protein-ligand interactions.
![]()
PandaMap is a lightweight tool for visualizing protein-ligand interactions from PDB files. It generates intuitive 2D interaction diagrams that display both the ligand structure and its interactions with protein residues.
Key features:
- Multiple structure format support e.g., pdb, mmcif, cif, pdbqt
- Visualization of protein-ligand interactions with minimal dependencies
- 2D representation of ligand structure without requiring RDKit
- Detection of multiple interaction types (hydrogen bonds, π-stacking, hydrophobic)
- Command-line interface for quick analysis
- Python API for integration into computational workflows
pip install pandamapOR
pip install pandamap[fancy]- dssp #It can be installed externally
brew install dssp #mac users
sudo apt-get install dssp #linux users
Windows: Download from https://swift.cmbi.umcn.nl/gv/dssp/ - NumPy
- Matplotlib
- BioPython
usage: pandamap [-h] [--output OUTPUT] [--ligand LIGAND] [--dpi DPI]
                [--title TITLE] [--version] [--report]
                [--report-file REPORT_FILE]
                structure_file


PandaMap: Visualize protein-ligand interactions from structure files

positional arguments:
  structure_file        Path to structure file (PDB, mmCIF/CIF, or PDBQT
                        format)

options:
  -h, --help            show this help message and exit
  --output OUTPUT, -o OUTPUT
                        Output image file path
  --ligand LIGAND, -l LIGAND
                        Specific ligand residue name to analyze
  --dpi DPI             Image resolution (default: 300 dpi)
  --title TITLE, -t TITLE
                        Custom title for the visualization
  --version, -v         Show version information
  --report, -r          Generate text report
  --report-file REPORT_FILE
                        Output file for the text report (default: based on
                        structure filename)
# Basic usage
pandamap protein_ligand.pdb --output interactions.png
pandamap complex.cif --output cif_interaction.png
# Specify a particular ligand by residue name
pandamap protein_ligand.pdb --ligand LIG
#Add report
pandamap complex.pdb --report-file complex.txt --report --lig PFL
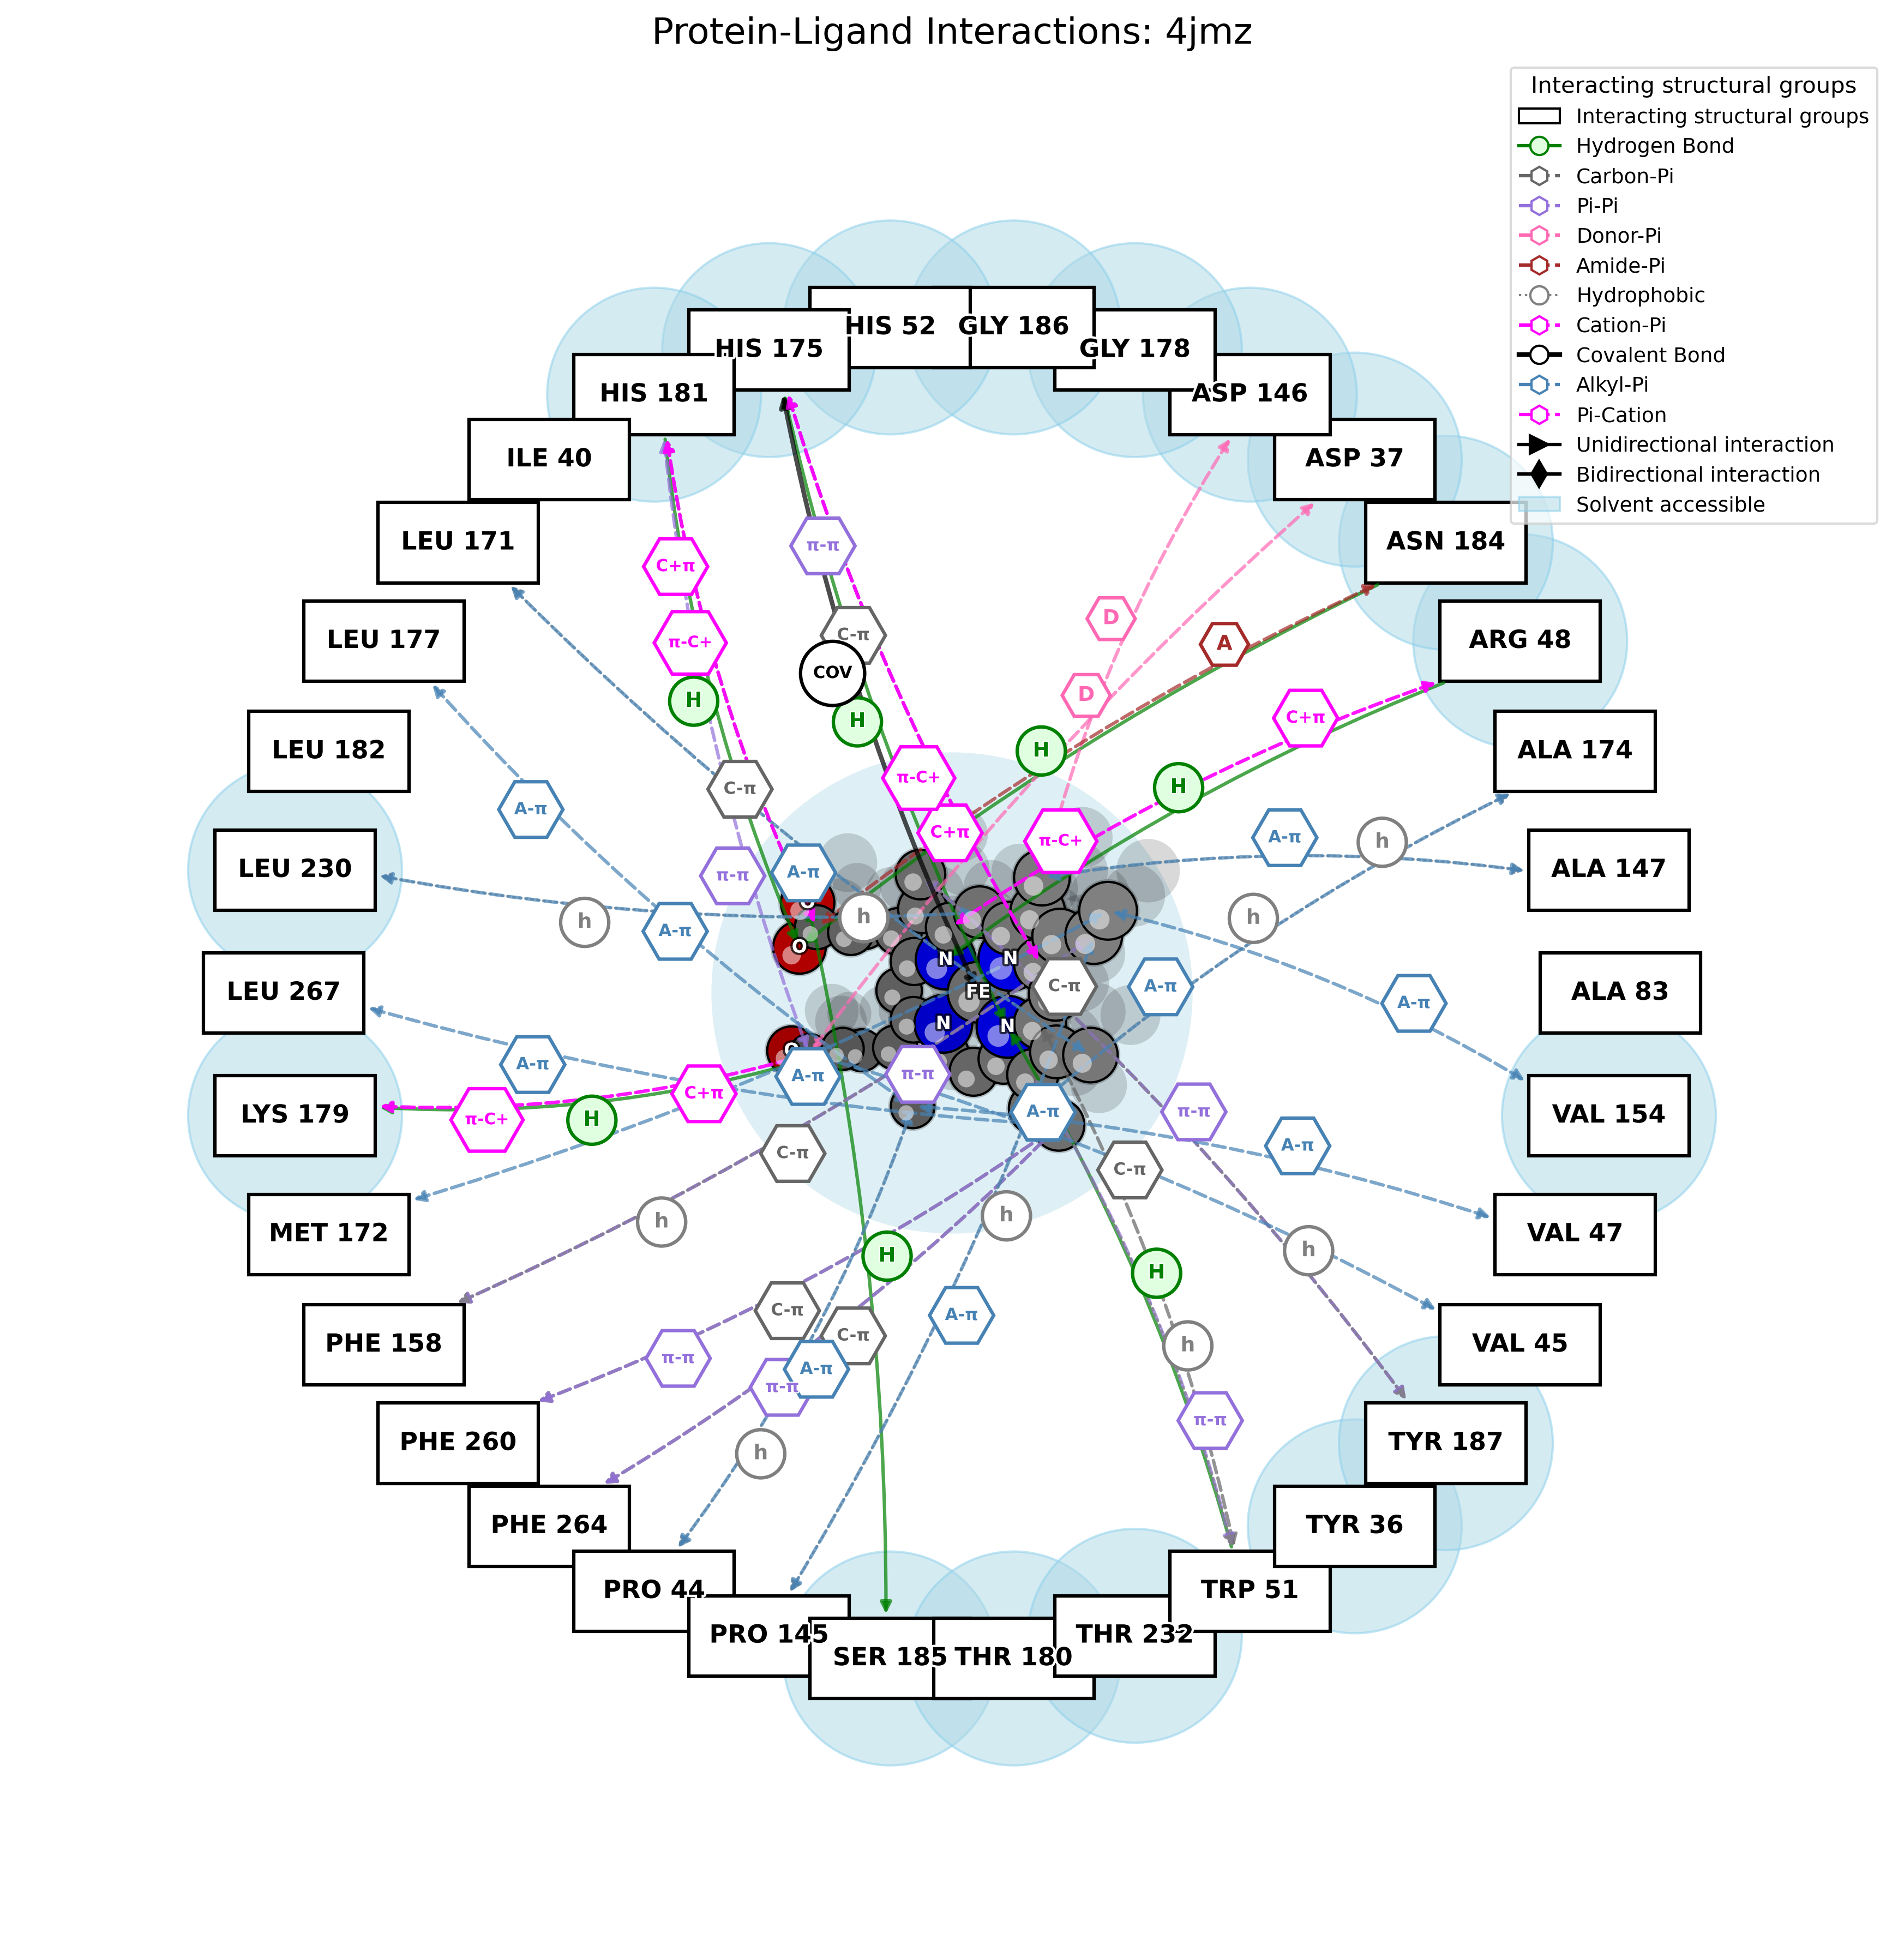
pandamap 4jmz.pdb --ligand HEM --report-file HEM.txt --report
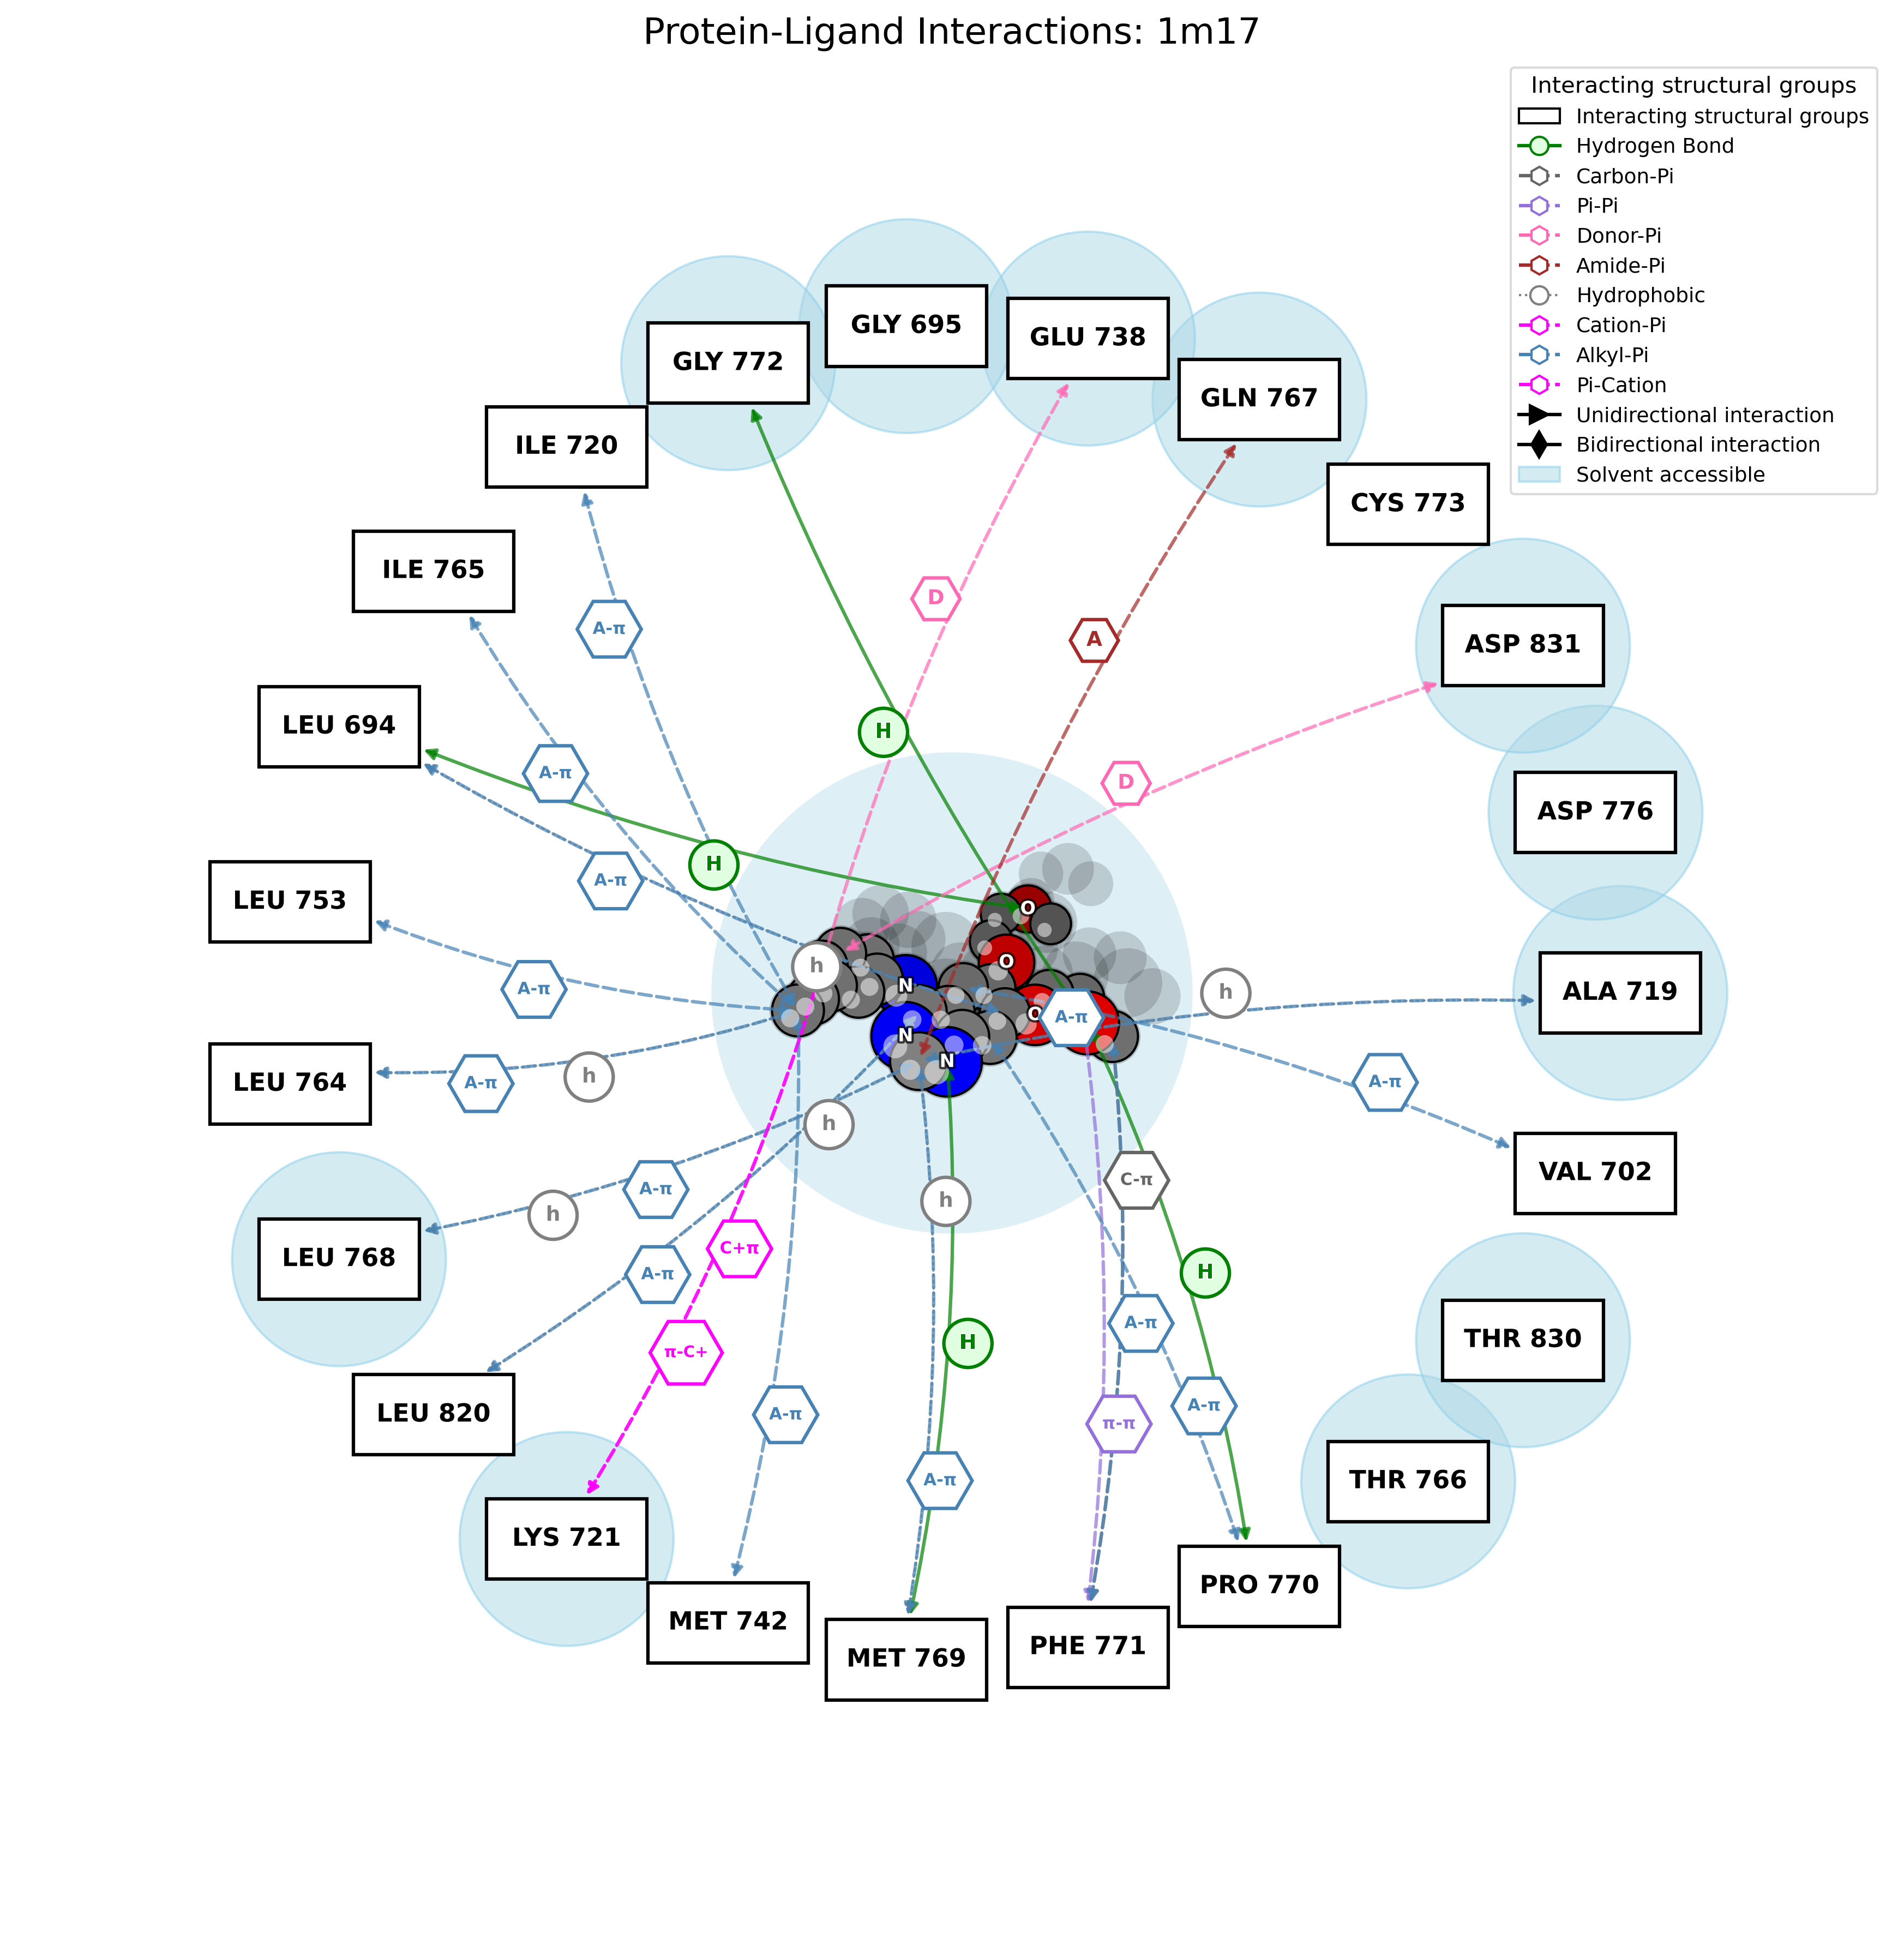
pandamap 1m17.pdb --ligand AQ4 --report-file 1m17.txt --reportfrom pandamap import HybridProtLigMapper
# Initialize with PDB file
mapper = HybridProtLigMapper("protein_ligand.pdb", ligand_resname="LIG")
# Run analysis and generate visualization
output_file = mapper.run_analysis(output_file="interactions.png")
# Or run steps separately
mapper.detect_interactions()
mapper.estimate_solvent_accessibility()
mapper.visualize(output_file="interactions.png")mapper.visualize(output_file="interactions.png")
mapper = HybridProtLigMapper("protein_ligand.pdb")
mapper.run_analysis(use_dssp=True)
mapper.visualize(output_file="interactions.png")
mapper.visualize(output_file="interactions.png")
mapper.run_analysis(use_dssp=False)
mapper.visualize(output_file="interactions.png")
from improved_interaction_detection import ImprovedInteractionDetection

# After you've created and run your mapper
mapper = HybridProtLigMapper(...)
mapper.run_analysis()

# Apply improved filtering as a post-processing step
detector = ImprovedInteractionDetection()
filtered_interactions = detector.refine_interactions(mapper.interactions)

# Generate a report
report = detector.generate_report(
    {
        'hetid': mapper.ligand_residue.resname,
        'chain': mapper.ligand_residue.parent.id,
        'position': mapper.ligand_residue.id[1],
        'longname': mapper.ligand_residue.resname,
        'type': 'LIGAND'
    },
    filtered_interactions,
    "interaction_report.txt"
)
=============================================================================
PandaMap Interaction Report
=============================================================================
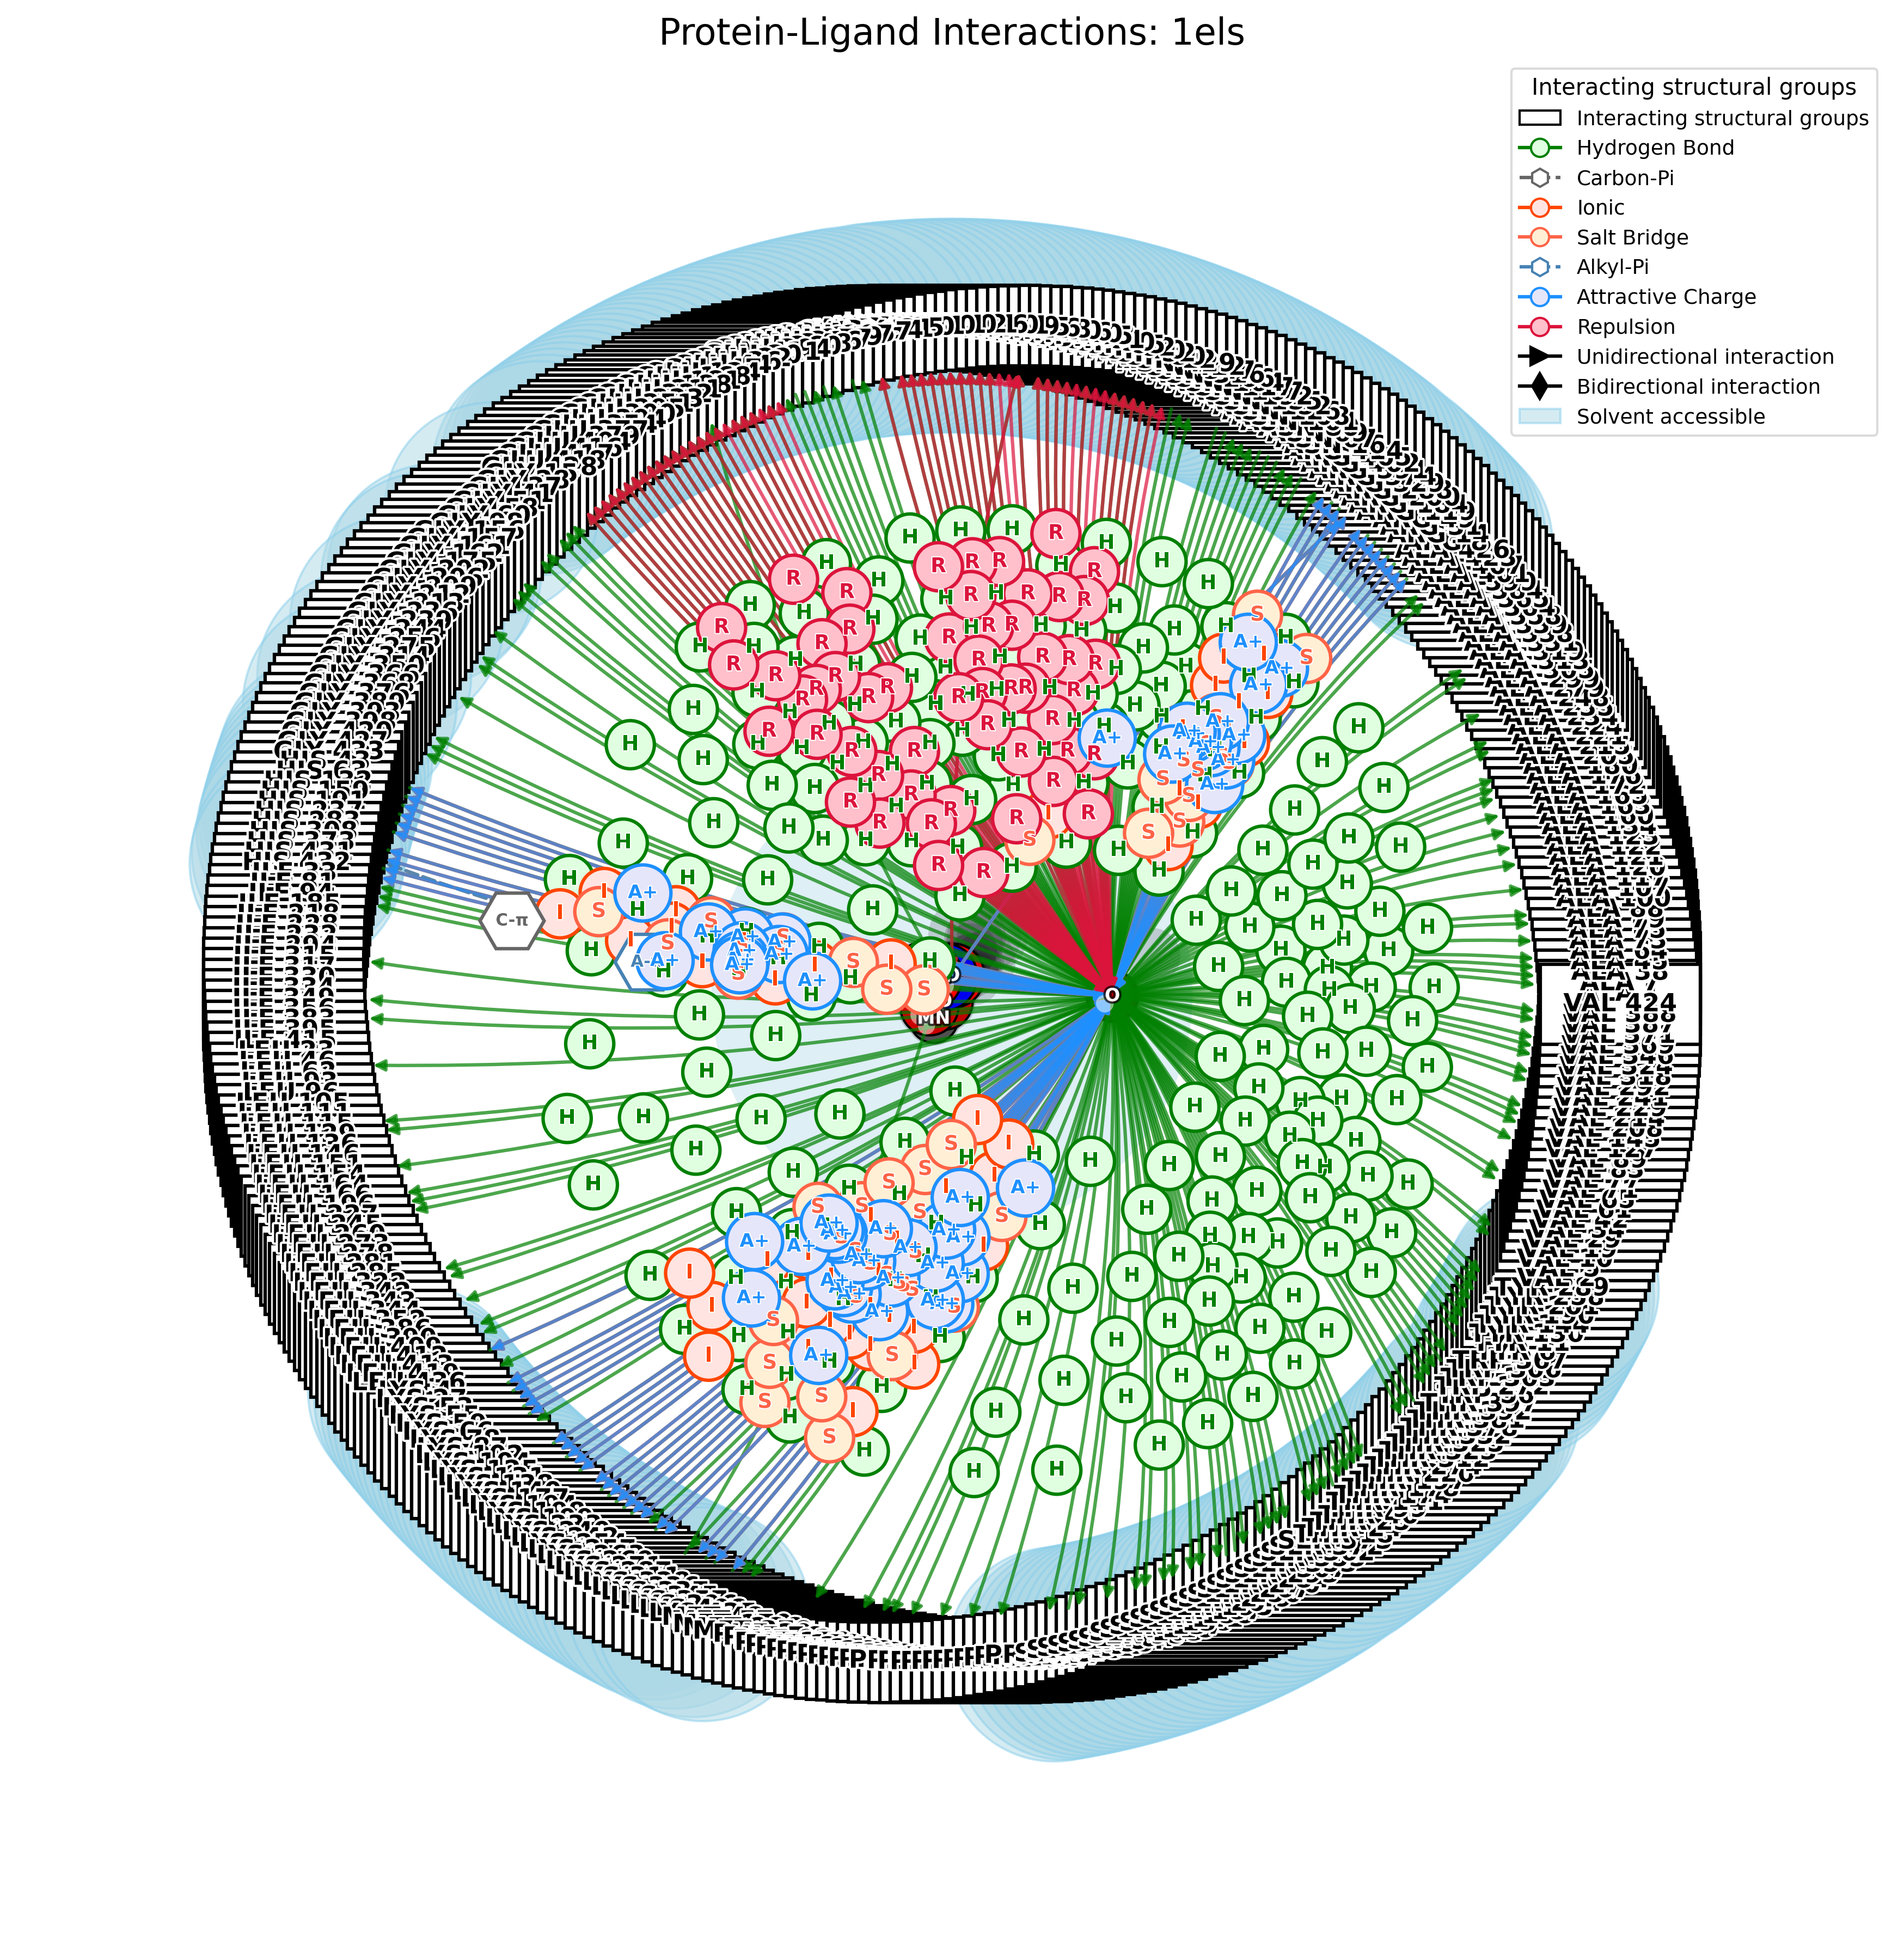
Ligand: PAH:A:439
Name: PAH
Type: LIGAND
------------------------------
Interacting Chains: A
Interacting Residues: 13
------------------------------
Interaction Summary:
Hydrogen Bonds: 10
Carbon-π Interactions: 1
Metal Coordination: 4
Ionic Interactions: 2
Salt Bridges: 2
Alkyl-π Interactions: 1
Attractive Charge: 2
Repulsion: 5
------------------------------
Hydrogen Bonds:
1. GLU168A -- 2.66Å -- PAH
2. ASP246A -- 2.60Å -- PAH
3. GLN167A -- 3.10Å -- PAH
4. ASP320A -- 3.46Å -- PAH
5. LYS396A -- 3.05Å -- PAH
6. SER375A -- 2.82Å -- PAH
7. SER39A -- 3.06Å -- PAH
8. ARG374A -- 2.98Å -- PAH
9. GLY37A -- 3.36Å -- PAH
10. LYS345A -- 3.21Å -- PAH
------------------------------
Carbon-π Interactions:
1. HIS373A -- 4.29Å -- PAH
------------------------------
Metal Coordination:
1. ASP246A -- 2.24Å -- PAH
2. GLU295A -- 2.24Å -- PAH
3. ASP320A -- 2.19Å -- PAH
4. GLY37A -- 2.12Å -- PAH
------------------------------
Ionic Interactions:
1. ARG374A -- 2.98Å -- PAH
2. LYS345A -- 3.21Å -- PAH
------------------------------
Salt Bridges:
1. ARG374A -- 2.98Å -- PAH
2. LYS345A -- 3.21Å -- PAH
------------------------------
Alkyl-π Interactions:
1. HIS373A -- 5.27Å -- PAH
------------------------------
Attractive Charge:
1. ARG374A -- 2.98Å -- PAH
2. LYS345A -- 3.21Å -- PAH
------------------------------
Repulsion:
1. ASP320A -- 3.46Å -- PAH
2. GLU168A -- 3.10Å -- PAH
3. ASP246A -- 2.60Å -- PAH
4. GLU295A -- 3.95Å -- PAH
5. GLU211A -- 4.34Å -- PAH
=============================================================================
This version marks the first official stable release of PandaMap. After extensive development and refinement through earlier versions, PandaMap 4.0.0 provides a complete, stable API for visualizing protein-ligand interactions.
PandaMap has gone through several development phases:
-
Versions 1.x - 3.7.x (Initial Development): These early versions represented the development phase of PandaMap, with evolving APIs and features.
-
Version 4.0.0 (First Official Stable Release): This release marks the transition to a stable, production-ready package with a commitment to API stability and semantic versioning.
- API Stability: The core API will remain backwards compatible throughout the 4.x series
- Semantic Versioning: We now strictly follow semantic versioning:
- Patch releases (4.0.x): Bug fixes only
- Minor releases (4.x.0): New features, no breaking changes
- Major releases (x.0.0): May contain breaking changes
- Deprecation Policy: Features will not be removed without being deprecated in at least one minor release
All notable changes to PandaMap will be documented in this file.
The format is based on Keep a Changelog, and this project adheres to Semantic Versioning.
This is the first official stable release of PandaMap. After multiple development versions, we're now committing to API stability and following semantic versioning strictly.
- Complete and stable API for protein-ligand interaction visualization
- New interaction types:
- Alkyl-Pi interactions
- Attractive charge interactions
- Pi-cation interactions
- Repulsion interactions
- Improved solvent accessibility calculation with more realistic results
- Enhanced metal coordination detection and reporting
- Corrected solvent accessibility detection to show partial rather than complete accessibility
- Fixed missing metal ion interactions in text reports
- Comprehensive code cleanup and stability improvements
If you use PandaMap in your research, please cite:
Pritam Kumar Panda. (2025). Protein AND ligAnd interaction MAPper: A Python package for visualizing protein-ligand interactions with 2D ligand structure representation. GitHub repository. https://github.com/pritampanda15/PandaMap
This project is licensed under the MIT License - see the LICENSE file for details.