Tanya Dimitrov, Mingjian He, Robert Stickgold, Michael J Prerau, Sleep spindles comprise a subset of a broader class of electroencephalogram events, Sleep, 2021;, zsab099, https://doi.org/10.1093/sleep/zsab099
- General Information
- Hand Scoring TFσ peaks
- TFσ peak Detection
- Algorithm Description
- Other Processes and Parameters
- Citations
- Status
- References
The code in this repository is companion to the paper:
Tanya Dimitrov, Mingjian He, Robert Stickgold, Michael J Prerau, Sleep spindles comprise a subset of a broader class of electroencephalogram events, Sleep, 2021;, zsab099, https://doi.org/10.1093/sleep/zsab099
One of the most prominent waveform patterns observed in the sleep EEG is the spindle, originally observed as waxing-waning 14 Hz oscillatory bursts in the EEG1. Spindles have garnered substantial attention through numerous studies linking spindle activity to memory consolidation and neural plasticity during sleep 2,3, as wellas recent studies associating deviations in spindle activity and morphology with aging 4, Alzheimer’s disease 5, epilepsy 6, schizophrenia 7, and autism 8.
Since 1935, spindles have largely been identified by visual inspection and more recent automated spindle detection methods 9 are built to approximate human scoring rather than trying to identify objective markers of the neurophysiological phenomenon underlying spindles. A primary challenge with this approach is that spindles are easily obfuscated by other frequency activity in the EEG signal, making visual identification exceptionally difficult and highly variable between scorers.
Time-frequency analysis is well suited to solve this problem because it can disambiguate the dynamics of simultaneously occurring time-varying oscillatory activity. In particular, any short burst of oscillatory activity will appear as a peak in the time-frequency domain. In our paper, we define time-frequency peaks in the sigma range (10-16 Hz), which we term TFσ peaks. We show that traditional spindle activity is a non-separable subset of TFσ peaks, and that TFσ peaks more robustly characterize the underlying neurophysiological activity, with significantly greater night-to-night stability relative to spindles.
Herein, we provide code for our automated detection of TFσ peaks, as well as the code to hand-score TFσ peaks from the spectrogram.
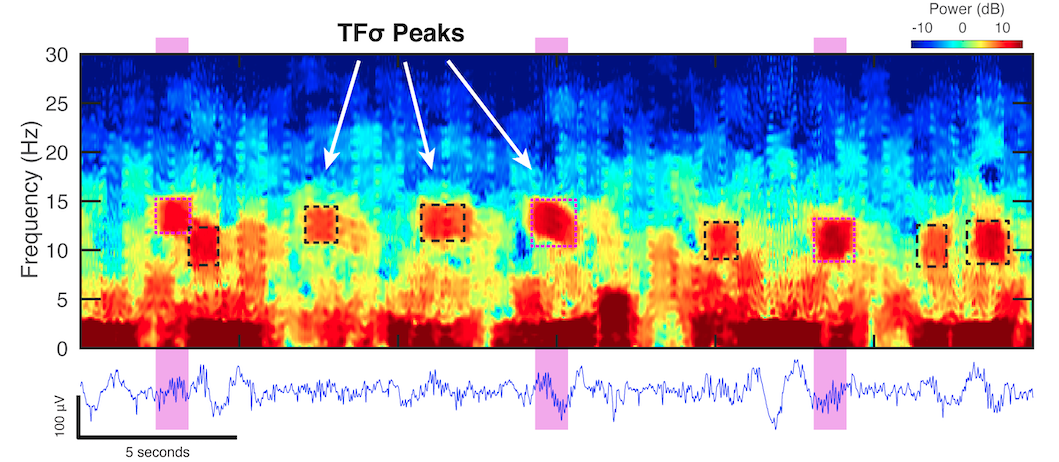
Spindles are a subset of TFσ peaks. Traditionally scored spindles (magenta regions) are represented as sigma range (10-16Hz) time-frequency peaks in the spectrogram (TFσ peaks) (boxed regions). While scored spindles correspond directly to TFσ peaks, there are many clear TFσ peaks that are not scored as spindles. Source: Dimitrov et. al 10
The hand_scoring_tfpeaks function can be used to manually identify TFσ peaks on multitaper spectrograms. Running this function on EEG data opens an interface with the data spectrogram, hypnogram, and time-series signal. This interface allows, zooming, colorscale adjustment, TFpeak/event marking (bounding box creation), and saving of the TFpeak/event labels.
Hotkeys for interacting with scoring interface:
- backspace/delete: delete selected bounding box
- space: advance forward in time window (with 10% overlapping)
- s: after pressing s, left-clicking on the spectrogram will begin marking the bounding box as a TFpeak
- u: after pressing u, left-clicking on the spectrogram will begin marking the bounding box as an unknown event
- p: call the zooming panel
- c: call the colorscale adjustment panel
Usage:
hand_scoring_tfpeaks(data, Fs, staging)
The following code shows how to load in test EEG data and run the hand_scoring_tfpeaks function -
%Make sure to start parallel pool if available
if license('test','distrib_computing_toolbox')
	gcp;
end

load('example_data/example_data.mat')  % loads in example data variables EEG, Fs, night, stage_times, stages, subject_name, t
hand_scoring_tfpeaks(EEG, Fs, staging)
The follow interface will appear and TFpeak/event scoring can begin -

Matlab Toolboxes reequired for hand_scoring_TFpeaks:
- Signal Processing Toolbox
- Image Processing Toolbox
- Statistics and Machine Learning Toolbox
The TF_peak_detection function uses multitaper spectrogram to identify time-frequency domain peaks.
Usage:
[spindle_table] = TF_peak_detection(EEG, Fs, sleep_stages)

[spindle_table, spectrogram_used, fpeak_proms, fpeak_properties, tpeak_properties, noise_peak_times, lowbw_TFpeaks, fh] = TF_peak_detection(EEG, Fs, sleep_stages, kwargs)
- EEG - 1D vector of signal data (required)
- Fs - sampling frequency of EEG data (Hz) (required)
- sleep_stages - n x 2 matrix where the 1st column is the timestamps of sleep stage changes and the 2nd column should be the new sleep stage at that timestamp. The stage coding in column 2 must be - WAKE=5, REM=4, NREM1=3, NREM2=2, NREM3=1, UNDEFINED=0 (required)
- detection stages: vector of sleep stages in which spindles should be detected. The stage coding is - WAKE=5, REM=4, NREM1=3, NREM2=2, NREM3=1, UNDEFINED=0. (optional keyword argument - default=[1,2,3])
- to_plot - logical to plot hypnoplot, spectrogram, and bounding boxes around detected spindles on the spectrogram (optional keyword argument - default=true).
- verbose - logical to output informative text to the Matlab console (optional keywork argument - default=true)
- spindle_freq_range - 2 element vector specifying lower and upper frequency bounds in which TFpeaks can be found (optional keywork argument - default=[0, Fs/2])
- extract_property - logical to output various properties of all TFpeaks found before separating into noise and signal TFpeaks. Note that if this argument is true, the process will stop before separating TFpeaks into noise and signal. (optional keywork argument - default=false)
- artifact_detect - logical to perform artifact detection on EEG before spindle detection. Note that segments identified as artifacts have their stages changed to WAKE (5). (optional keyword argument - default=true)
- peak_freq_range - 2 element vector specifying range of frequencies to look for peak prominence values within (optional keyword argument - default=[9,17])
- find_freq_range - 2 element vector (optional keyword argument - default=[max(0, peak_freq_range(1)-spectral_resol), min(Fs/2, peak_freq_range(2)+spectral_resol])
- in_db - logical to convert spectrogram from power to dB (optional keyword argument - default=false)
- smooth_Hz - double in Hz to specify smoothing of each slice of spectrum before peak finding (optional keyword argument - default=0)
- smooth_sec - double in seconds to specify window over which average smoothing of time-domain prominance curve occurs (optional keyword argument - default=0.3)
- min_peak_distance_sec - double in seconds to spefify the minimum peak width required for a peak to be detected (optional keywork argument - default=0.3)
- detection_method - char specifying the method of separating noise peaks from signal peaks. Options are 'kmeans' and 'threshold' (optional keyword argument - default='kmeans')
- bandwidth_cut - all spindles with a bandwidth below half of the spectral resolution (default: 4Hz) will be rejected (optional keyword argument - default=true)
- num_clusters - integer to specify the number of clusters used in kmeans clustering to cluster noise peaks from signal peaks. Note that only the cluster with the highest peak prominance will be selected as signal and the other clusters will be specfied as noise. (optional keyword argument - default=2)
- threshold_percentile - double between 0 and 100 specifying the percentile cutoff of candidate TFpeaks prominance values to use in distiguishing between noise and signal TFpeaks. Used only if detection_method is 'threshold'. (optional ketwork argument - default=75)
- MT_freq_max - double in Hz specifying the maximum frequency to use when computing the multitaper spectrogram. (optional keyword argument - default=30)
- MT_taper - 2 element vector specifying the multitaper spectrogram DPSS taper parameters. The 1st element is the desired time-halfbandwidth product and the 2nd element is the desired number of tapers. (optional keyword argument - default=[2,3])
- MT_window - 2 element vector spevifying the multitaper spectrogram time window parameters. The 1st element is the window size in seconds and the 2nd element is the step size in seconds (optional keywork argument - default=[1, 0.005])
- MT_min_NFFT - integer specifying the minimum allowable NFFT size, adds zero padding for interpolation. (optional keyword argument - default=210)
- MT_detrend - char specifying the method of detrending for each window of data in the multitaper spectrogram calculation. Possible choices are: 'linear', 'constant', and 'off'. (optional keyword argument - default='constant')
- MT_weighting - char specifying the method of DPSS taper weighting during the multitaper spectrogram caluclation. Possible choices are: 'unity', 'eigen', and 'adapt'. (optional keyword argument - default='unity')
The following code demostrates the usage of TF_peak_detect -
%Make sure to start parallel pool if available
if license('test','distrib_computing_toolbox')
	gcp;
end

load('example_data') % load the data

% run the TF_peak_detection wrapper function to detect TF peaks during
% NREM2 sleep, with TF peak central frequencies confined to 10-16Hz
% Note: consider using clims.m to adjust color scale
[ TFpeaks_table, spectrogram_used, fpeak_proms, fpeak_properties, tpeak_properties ] = TF_peak_detection(EEG, Fs, [stage_times', stages'],...
        'to_plot',true, 'spindle_freq_range',[10,16], 'detection_stages',[2]);
Running the code should produce the following plot showing the data segment hypnogram, spectrogram, and bounding boxes indicating TFpeaks -
|
Matlab Toolboxes reequired for TF_peak_detection:
- Signal Processing Toolbox
- Statistics and Machine Learning Toolbox
- Curve Fitting Toolbox
In order to extract TFσ peaks from the spectrogram, we developed a two step procedure that isolates well-formed peaks in the time-frequency domain spectrogram. The first step is the "frequency step", which finds clear peaks in power from each individual spectrum in the spectrogram. The second step is the "time step", which tracks the prominence of the extracted spectral peaks found over time and finds temporal peak.
The “frequency step” is based on the concept of peak prominence, which stems from geological studies [1] and measures of the height of a peak relative to the lowest contour line around it that excludes higher peaks. In essence, peak prominence computes the magnitude (height, power, amplitude) of a peak relative to a hyper-local baseline. Thus, prominence provides a better description of EEG spectral peak magnitude than absolute power or a global baseline, accounting for instantaneous offsets in power as well as for the background 1/f slope in the frequency dimension [2]. We first estimate the multitaper spectrogram using the same parameters described above and apply the MATLAB findpeaks() function for each spectrum, estimating prominence, frequency at maxima, and bandwidth for all peaks in the frequency range 6-30 Hz. This broad range was to provide the data required to accurately compute prominence while excluding confounding effects from slow/DC activity. We then select peak within 9-17 Hz with maximal prominence, which we term the max-prominence peak for each time window. We then construct a prominence time series by concatenating prominence values of all max-prominence peaks across time windows. Time windows containing artifacts, falling outside of N2 sleep, or having no valid peak in the 9-17 Hz range were marked as missing values. Therefore, the frequency prominence time series spanned the full night, sampled at intervals of the step size (0.05 s) used in multitaper spectrogram estimation.
For the “time step”, we perform peak extraction again on the prominence time series. We smooth the frequency prominence with a 0.3 s moving average window to avoid small inflection points being considered as peaks in the next step. We then apply the findpeaks() function on the smoothed time series to identify prominent peaks along the time dimension. As this second round of peak finding operates on a time series of prominence values, the computed “prominence of prominence” provided a single numerical value quantifying the distinctiveness of a time-frequency peak (local maximum). We converted the obtained (time) prominence values to the logarithmic scale due to observed log-normal distributions.
Having identified salient time-frequency peaks in spindle frequency range across the night, we use the parameters of these peaks to extract event properties. For an event detected by any method (by hand-scoring or automated detectors, in the time or time-frequency domain), we defined the scored interval using the marked onset and offset times of the event. The time-frequency peak with temporal maximum closest to the midpoint of the scored interval was assigned to the event. For a given peak in the prominence time series, with the maximum at time t, we extract the following four properties of the assigned event:
- Prominence = natural log of the peak prominence
- Duration = half-prominence width of the peak
- Central Frequency = frequency of the max-prominence peak of the spectrum at t
- Bandwidth = half-prominence width of the max-prominence peak of the spectrum at t
If multiple peaks occurred during the event interval, the local maximum with the highest prominence was assigned. If no local maximum in the prominence time series overlapped with the scored interval (<2% for all methods and subjects), features were determined using the closest peak available (always occurred within 5 s from the event interval midpoint) based on the following rules. For an event with the event interval midpoint at tm and a corresponding peak closest to the event with its maximum at time t in the prominence time series:
- Prominence = natural log of the peak prominence – (prominence at t – prominence at tm)
- Duration = event offset time – event onset time
- Central Frequency = frequency of the max-prominence peak of the spectrum at tm
- Bandwidth = half-prominence width of the max-prominence peak of the spectrum at tm
In summary, this algorithm identifies the most prominent, well-defined time-frequency peak within a given time period and extracts the four associated properties. Since the only needed inputs are event onset and offset times, this algorithm is agnostic to the details of how an event is detected. Thus, properties can be extracted equitably for all methods investigated in the present study, allowing fair comparisons across time and time-frequency domains. It should be noted this approach does not explicitly handle multiple overlapping time-frequency events, however simultaneously co-occurring events are rare in the sigma range, thus making this an appropriate method in this application.
In order to derive a principled separation of events from noise unique to each individual, we applied a two-class k-means clustering algorithm on the prominence values of the detected peaks for each subject. The cluster with higher mean prominence was labeled as TFσ peaks of interest, and the other cluster with lower prominence was labeled as noise peaks. This choice was motivated by the observation of bimodal or skewed peaks within the prominence distributions.
Prior to k-means clustering, we excluded peaks with durations shorter than 0.3 second to match consensus. We further excluded peaks with frequency bandwidths less than half of the spectral resolution of the multitaper spectrograms (4 Hz/2 = 2 Hz), as peaks of this bandwidth are not resolvable by the spectral 60estimator. After k-means clustering, we exclude any detected events outside the 10–16 Hz range, to match with the method described in Wamsley et al.
The multitaper_spectrogram_release function is used by TF_peak_detection to break down the EEG signal into the time-frequency domain. More information on the multitaper spectrogram and the latest release of the function can be found here
The default spectrogram parameters used by TF_peak_detection are as follow:
- frequency_range = [0, 30] % Hz
- taper_params = [2, 3]
- window_params = [1, 0.05] % Seconds
- min_NFFT = 2^10
- detrend_opt = 'constant'
The EEG_detect_time_domain_artifacts function is used to detect artifacts in the EEG signal data before TFpeak detection is run.
Usage:
[artifacts] = EEG_detect_time_domain_artifacts(data, Fs)

[artifacts, hf_artifacts, bb_artifacts, high_detrend, broad_detrend] = EEG_detect_time_domain_artifacts(data, Fs, method, hf_crit, hf_pass, bb_crit, bb_pass, smooth_duration, verbose, histogram_plot)
- data - 1 x vector - time series data (required)
- Fs - double - sampling frequency in Hz (required)
- method - char 'std' to use iterative method (default) or a strict threshold on 'MAD',defined as K*MEDIAN(ABS(A-MEDIAN(A)))
- hf_crit - double - high frequency criterion - number of stds/MAD above the mean to remove (default: 4)
- hf_pass - double - high frequency pass band - frequency for high pass filter in Hz (default: 25 Hz)
- bb_crit - double - broadband criterion - number of stds/MAD above the mean to remove (default: 4)
- bb_pass - double - broadband pass band - frequency for high pass filter in Hz (default: .1 Hz)
- smooth_duration - double - time (in seconds) to smooth the time series (default: 2 seconds)
- verbose - logical - verbose output (default: false)
- histogram_plot - logical - plot histograms for debugging (default: false)
The code contained in this repository is companion to the paper:
Tanya Dimitrov, Mingjian He, Robert Stickgold, Michael J Prerau, Sleep spindles comprise a subset of a broader class of electroencephalogram events, Sleep, 2021;, zsab099, https://doi.org/10.1093/sleep/zsab099
which should be cited for academic use of this code.
All implementations are complete and functional.
- Loomis AL, Harvey EN, Hobart GA. Cerebral states during sleep, as studied by human brain potentials. J Exp Psychol. 1937;21(2):127
- Diekelmann S, Born J. The memory function of sleep. Nat Rev Neurosci. 2010;11(2):114-126.
- Fogel SM, Smith CT. The function of the sleep spindle: a physiological index of intelligence and a mechanism for sleep-dependent memory consolidation. Neurosci Biobehav Rev. 2011;35(5):1154-1165.
- Helfrich RF, Mander BA, Jagust WJ, Knight RT, Walker MP. Old brains come uncoupled in sleep: slow wave-spindle synchrony, brain atrophy, and forgetting. Neuron. 2018;97(1):221-230.
- Gorgoni M, Lauri G, Truglia I, et al. Parietal fast sleep spindle density decrease in Alzheimer’s disease and amnesic mild cognitive impairment. Neural Plast. 2016;2016.
- Myatchin I, Lagae L. Sleep spindle abnormalities in children with generalized spike-wave discharges. Pediatr Neurol. 2007;36(2):106-111.
- Manoach DS, Pan JQ, Purcell SM, Stickgold R. Reduced sleep spindles in schizophrenia: a treatable endophenotype that links risk genes to impaired cognition? Biol Psychiatry. 2016;80(8):599-608.
- Limoges E, Mottron L, Bolduc C, Berthiaume C, Godbout R. Atypical sleep architecture and the autism phenotype. Brain. 2005;128(5):1049-1061.
- Warby SC, Wendt SL, Welinder P, et al. Sleep-spindle detection: crowdsourcing and evaluating performance of experts, non-experts and automated methods. Nat Methods. 2014;11(4):385.
- Dimitrov T, He M, Stickgold R, Prerau MJ. Sleep spindles comprise a subset of a broader class of electroencephalogram events. Sleep. 2021 Apr 15:zsab099. doi: 10.1093/sleep/zsab099. Epub ahead of print. PMID: 33857311.