Releases: percona/pmm
v2.42.0
Percona Monitoring and Management 2.42.0
| Release date | June 11th, 2024 |
|---|---|
| Installation | Installing Percona Monitoring and Management |
Percona Monitoring and Management (PMM) is an open source database monitoring, management, and observability solution for MySQL, PostgreSQL, and MongoDB.
It enables you to observe the health of your database systems, explore new patterns in their behavior, troubleshoot them and execute database management operations regardless of whether your databases are located on-premises or in the cloud.
What's new in this release
This release introduces support for Ubuntu 24.04, configurable metrics resolutions per service, improved connection management for PostgreSQL and PMM Agent, and experimental dashboards for PMM self-monitoring and MongoDB.
The release also brings enhancements to MySQL Query Response Time Details, adds new metrics and labels for PostgreSQL, and addresses several issues related to MongoDB monitoring, upgrades, and Query Analytics and High Availability documentation.
Experimental dashboards in PMM are new or redesigned dashboards that are released as a preview feature for you to test and provide feedback, as we hope to include them as defaults in a future release.
Keep in mind that these dashboards are not considered fully stable or complete, and their design, functionality, and metrics may change in future releases based on user feedback and further development.
Release highlights
Ubuntu 24.04 Noble Numbat support
PMM now officially supports monitoring of databases running on the recently released Ubuntu 24.04 Noble Numbat operating system.
With this addition, PMM continues to provide comprehensive coverage across a wide range of Linux distributions commonly used in database deployments.
Check the full list of supported platforms on the Percona Software Support Lifecycle webpage.
For information on installing the PMM Client on Linux, see Set up PMM Client.
Configurable metrics resolutions per service
You can now configure metrics resolutions on a per-service basis by setting Low-Resolution (LR), Medium-Resolution (MR), and High-Resolution (HR) settings for each exporter individually.
Customizing the resolution settings for individual services means that you can fine-tune your PMM setup to balance data granularity and resource consumption. This will enable you to:
- allocate resources efficiently by focusing on high-resolution data for key services
- reduce storage requirements by adjusting resolution for less critical components
- align your monitoring setup with the specific needs of your environment
This feature is currently accessible via the PMM API and will be integrated into the user interface in a future release.
API call example:
sh curl --request POST \ --url https://<your-pmm-address>/v1/inventory/Agents/ChangePostgresExporter \ --header 'accept: application/json' \ --header 'content-type: application/json' \ --data ' { "common": { "metrics_resolutions": { "hr": "60s", "mr": "300s", "lr": "3600s" } }, "agent_id": "<agent-id>" } '
Improved connection management for PostgreSQL Services and pmm-agent
PMM now offers enhanced connection management capabilities for PostgreSQL services and the PMM Agent, to optimize resource utilization and prevent potential performance issues caused by excessive connections.
PostgreSQL services
When adding a new PostgreSQL services, you can now set a maximum limit on the number of connections that the PostgreSQL exporter can open to the same PostgreSQL instance.
This feature, previously available only through the CLI, is now also accessible through the PMM web interface as well:
- PostgreSQL service: PMM Configuration > Add Service > PostgreSQL > Configuring PostgreSQL Service
- RDS PostgreSQL service: PMM Configuration > Add Service > Amazon RDS > Discover with Amazon Credentials > RDS PostgreSQL
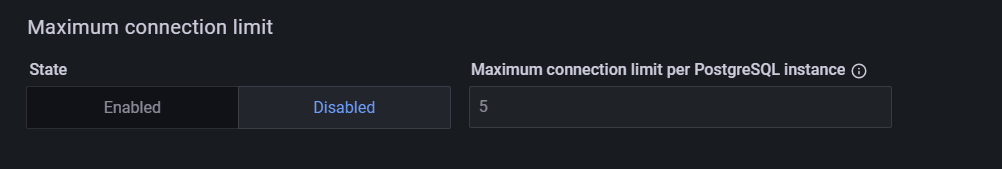
By setting a maximum connection limit, you can prevent excessive connections during concurrent operations, and ensure that connections are closed promptly to avoid idle connections.
When adjusting the maximum number of connections, consider the following:
- higher values might be needed for larger or busier instances.
- setting the limit too high can impact performance.
- if no limit is specified or the option is disabled, the server will manage the connection limits automatically.
PMM Agent
Similarly, you can now limit the number of connections that the PMM Agent opens to monitored databases for QAN, Advisors, and other systems.
Starting with this release, pmm-agent tracks all required resources (primarily connections), and opens no more than two connections per database instance simultaneously.
You can change this default value by setting a parameter or environment variable when starting the pmm-agennt.
For more information on configuring the PMM Agent and available parameters, see the PMM Agent help documentation by running pmm-agent --help.
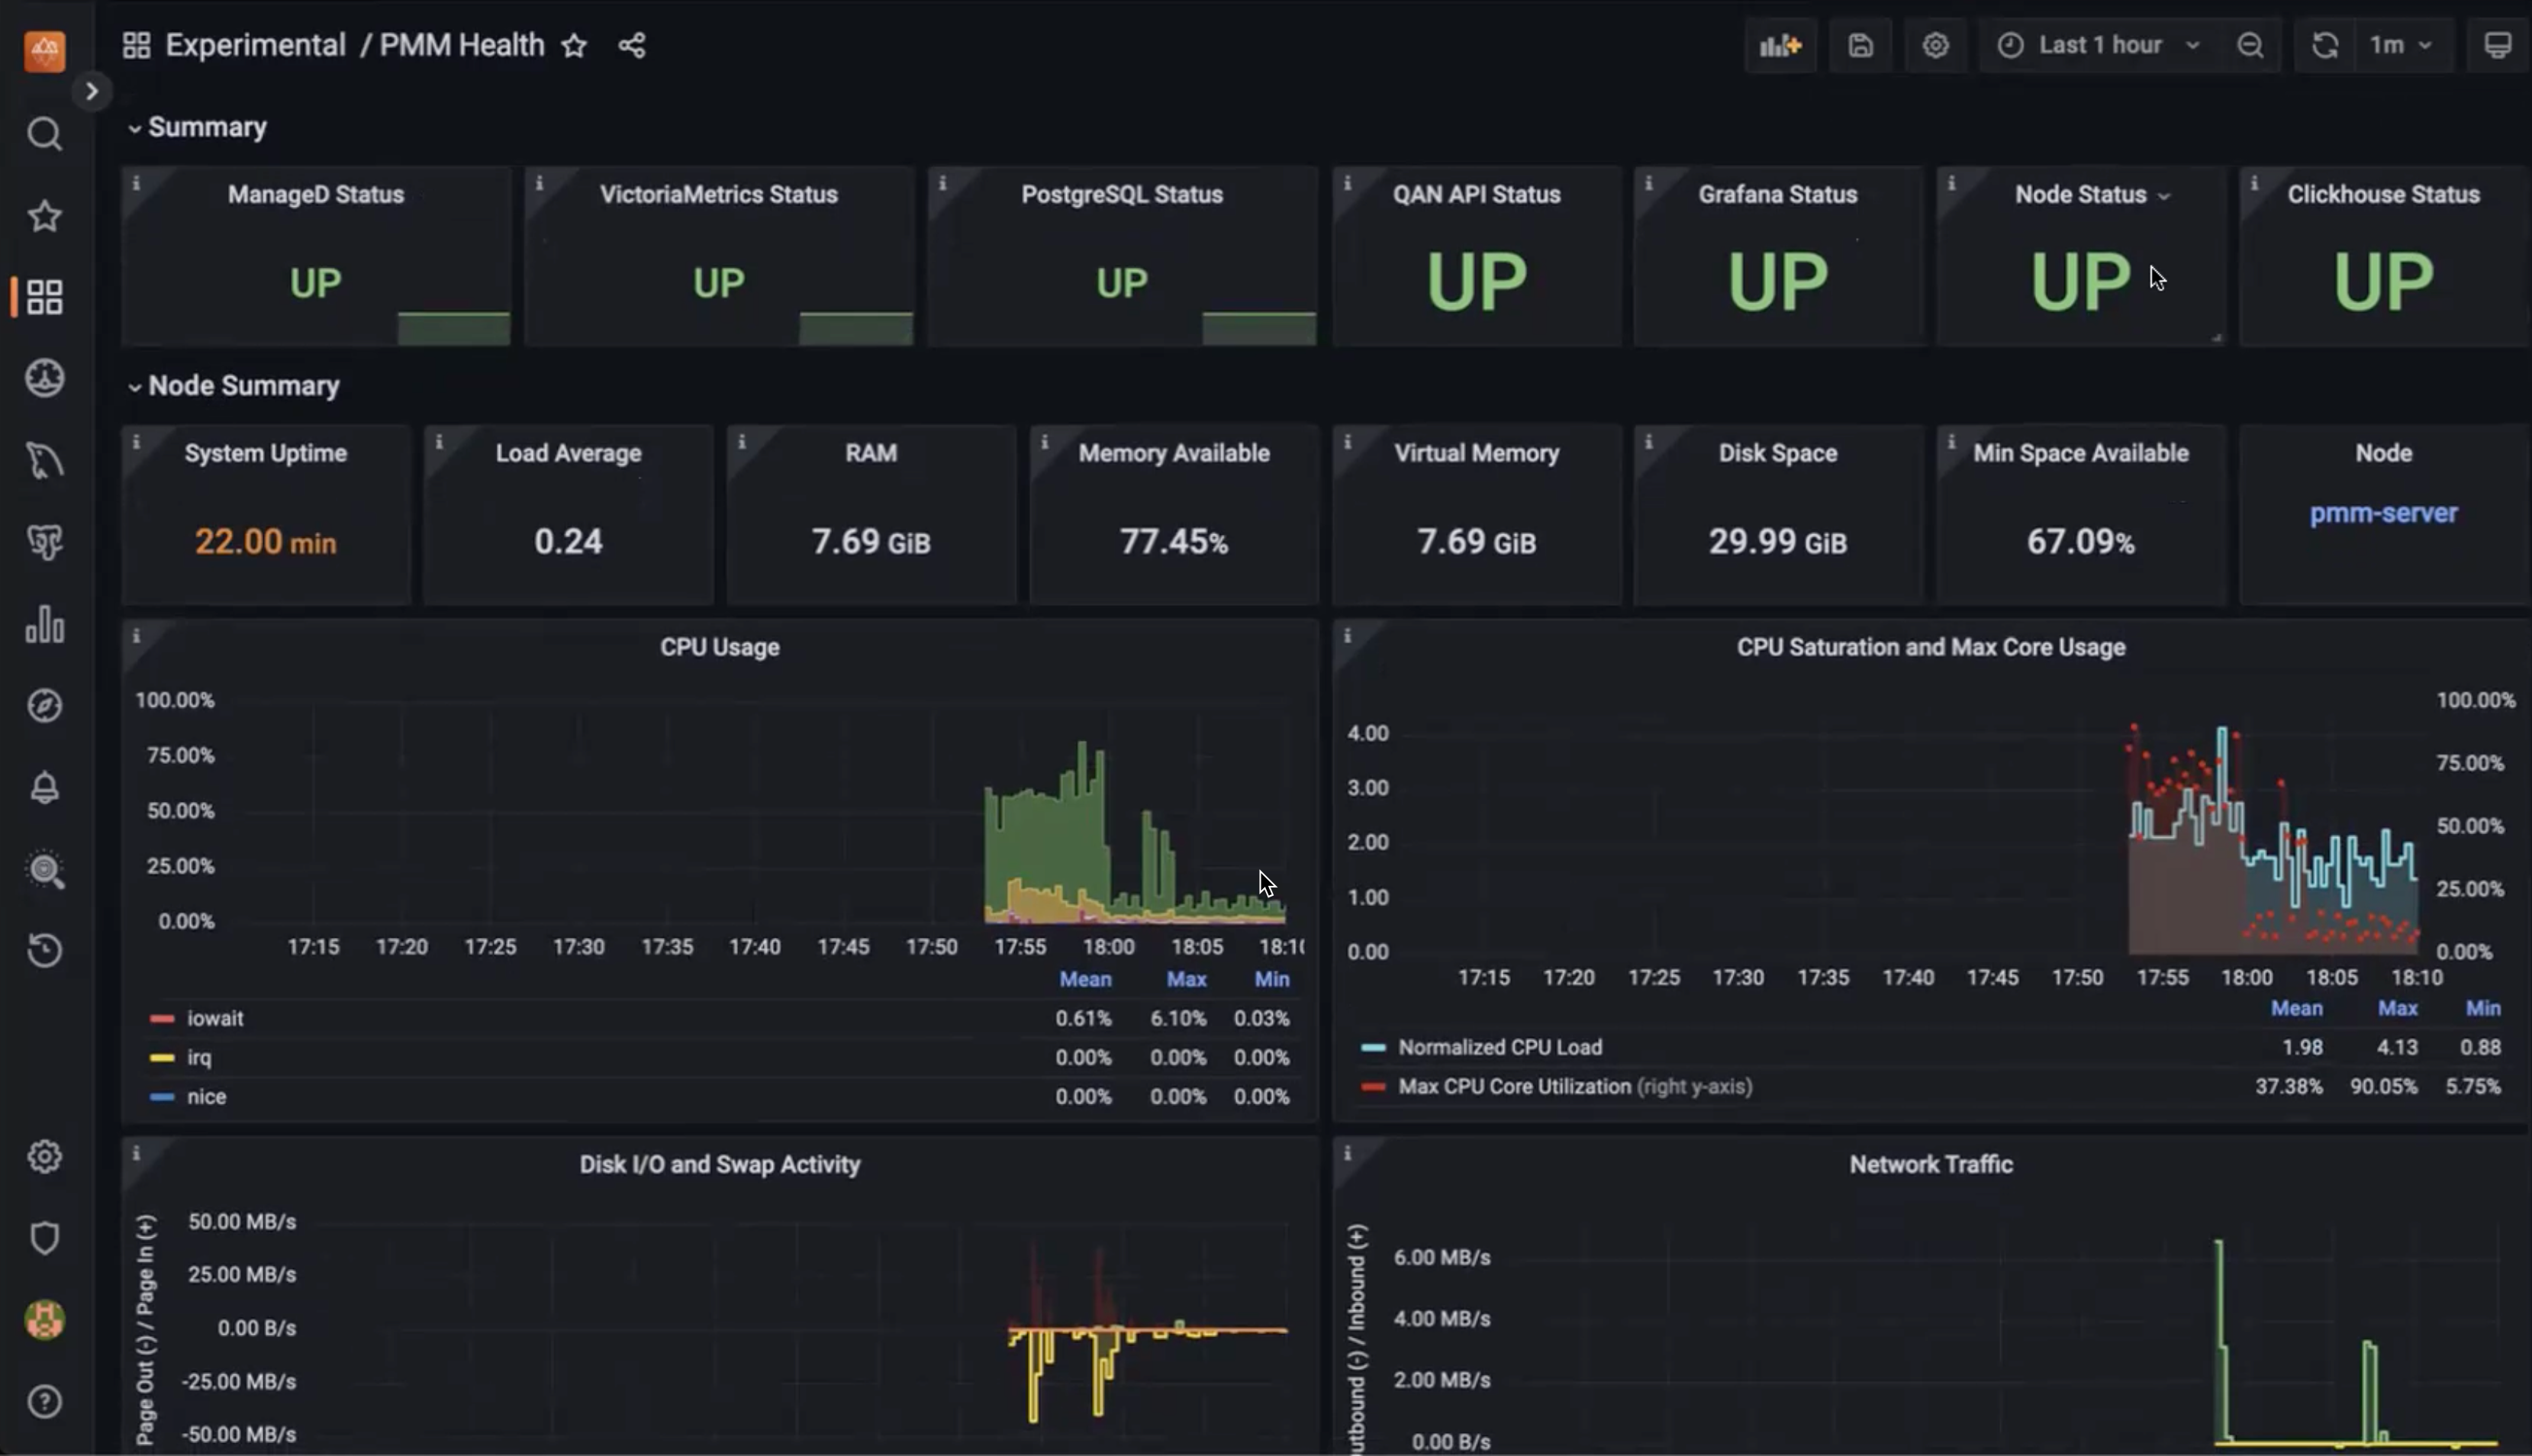
Experimental PMM self-monitoring dashboard
We've added a new experimental PMM Health dashboard to provide detailed insights into the health and performance of PMM itself.
The dashboard reflects the PMM architecture and covers key components such as overall component status, node health, Query Analytics, PMM-managed, Grafana, VictoriaMetrics, ClickHouse, and PostgreSQL metrics.
This initial version is available in the Experimental folder after updating PMM and contains a starter set of key metrics to help identify potential issues and ensure optimal operation.
For more information about this new dashboard, see the Keeping an eye on the eye blog post.
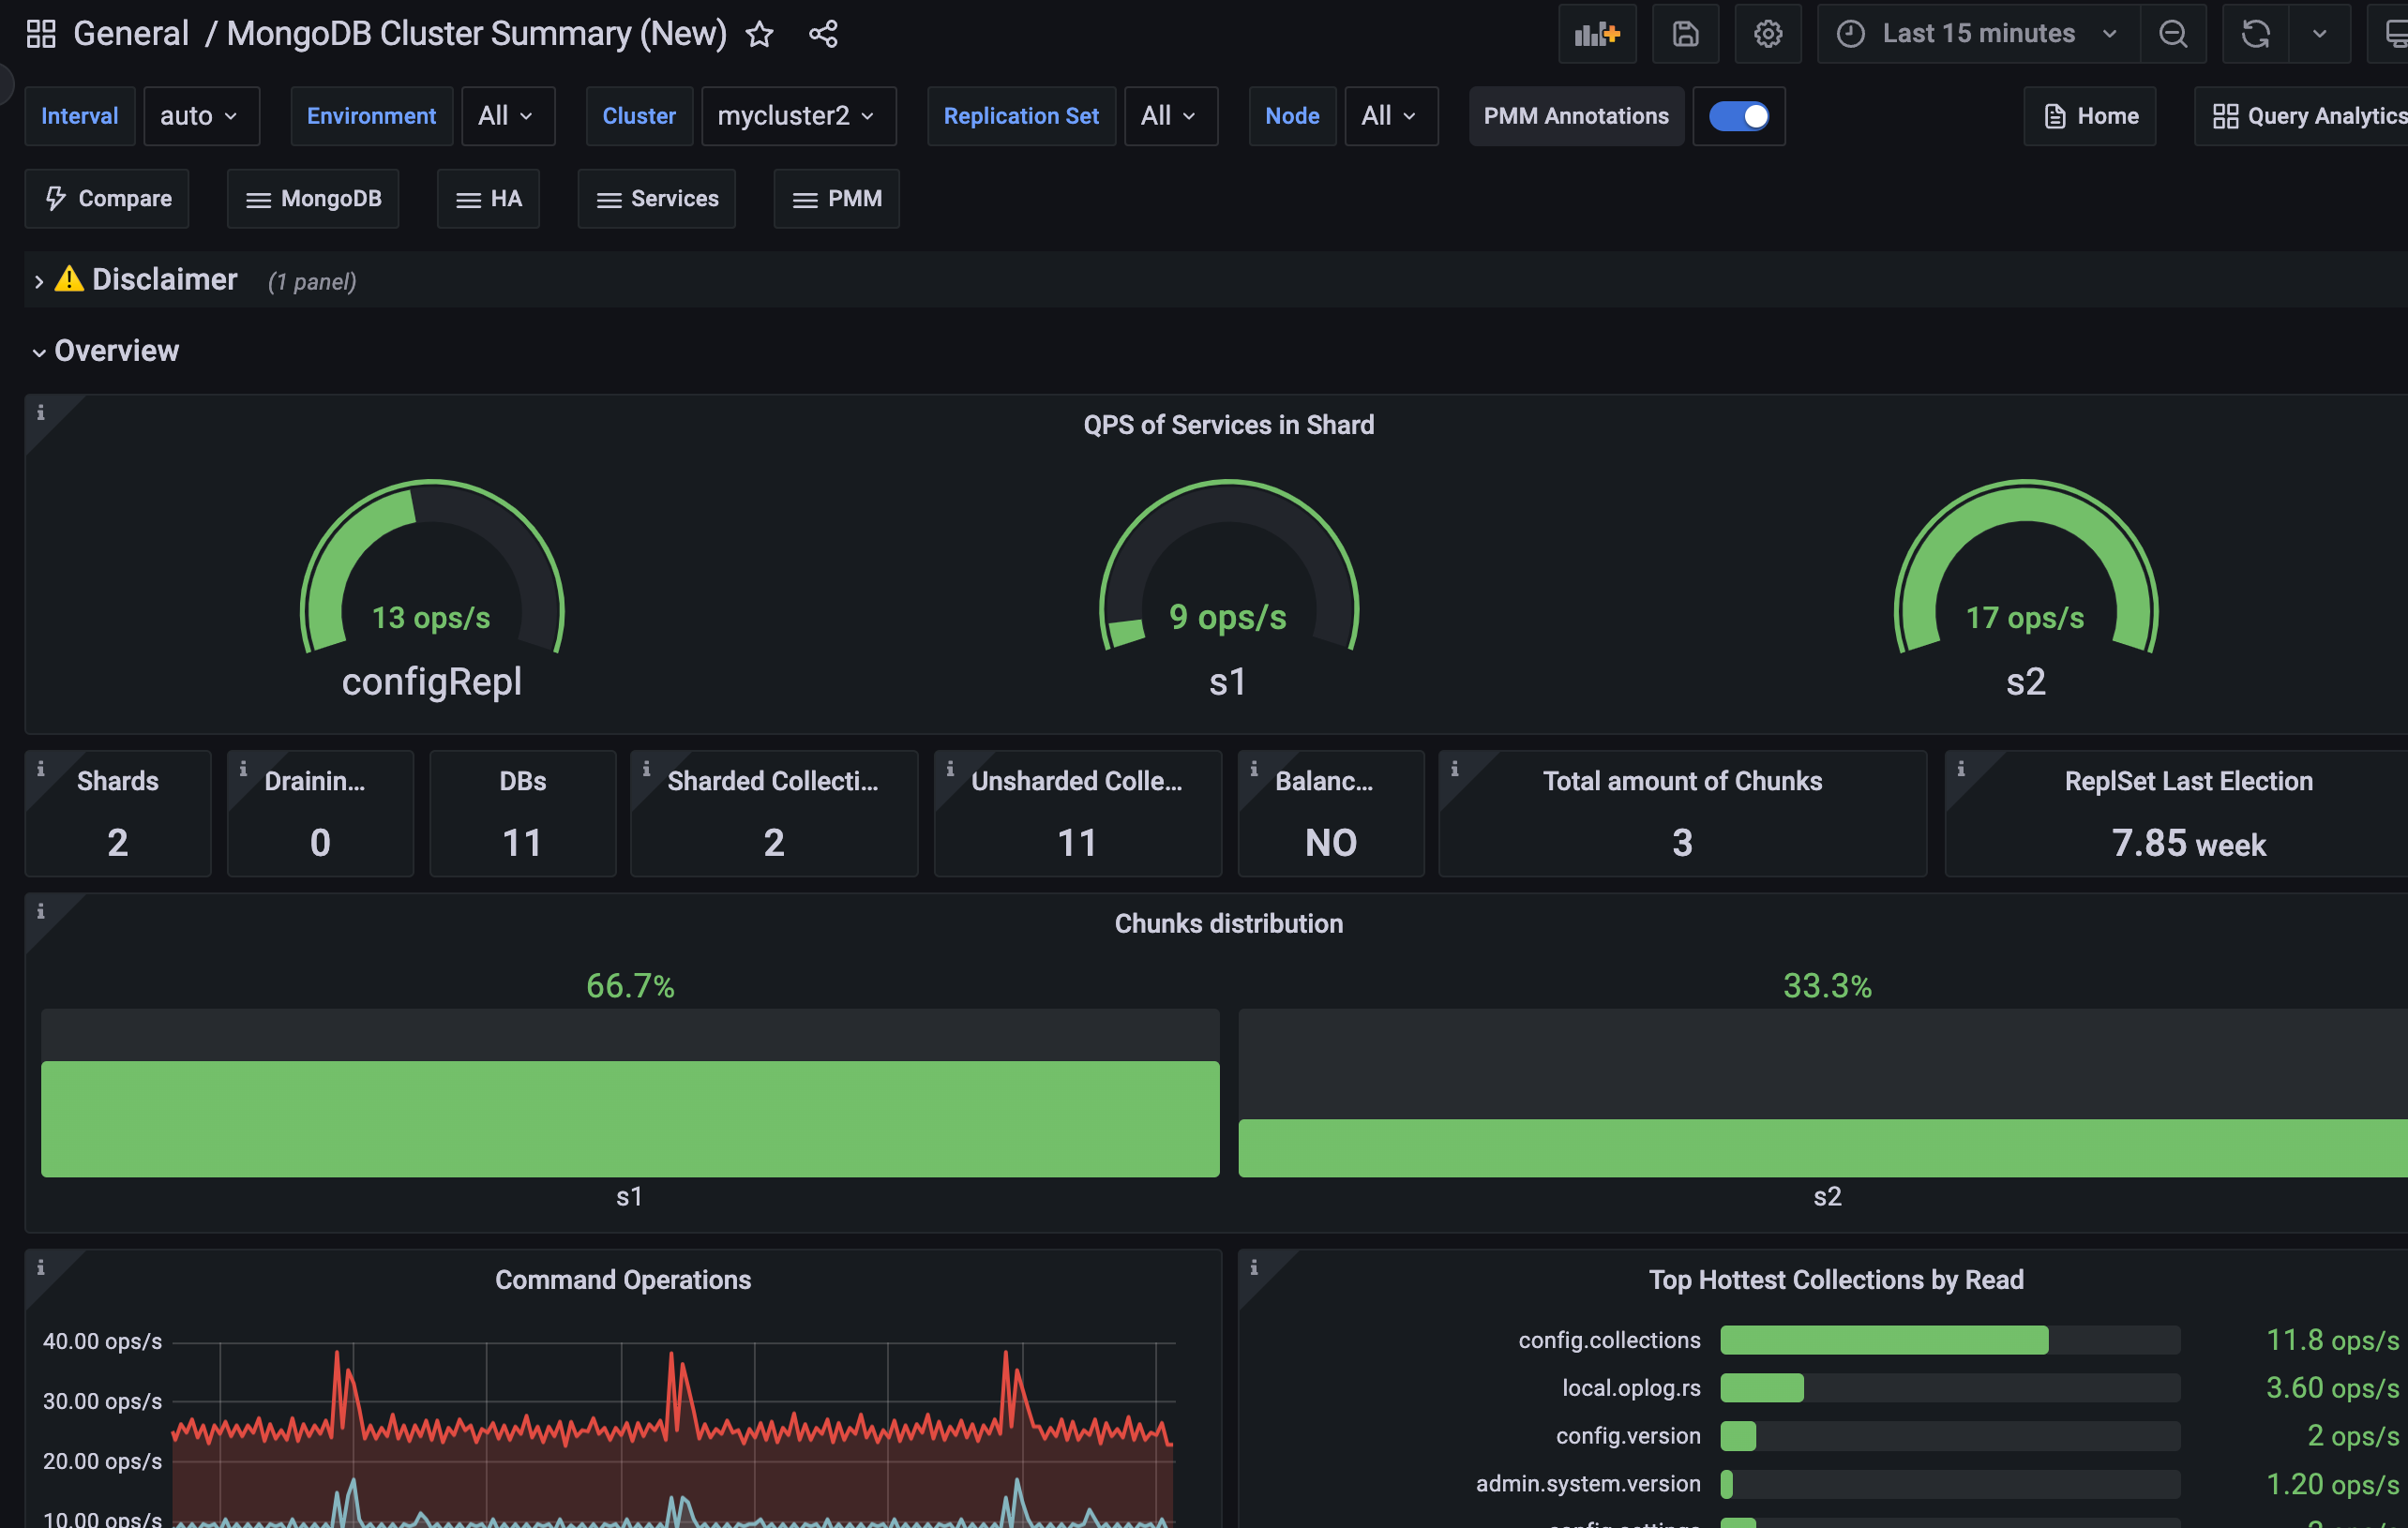
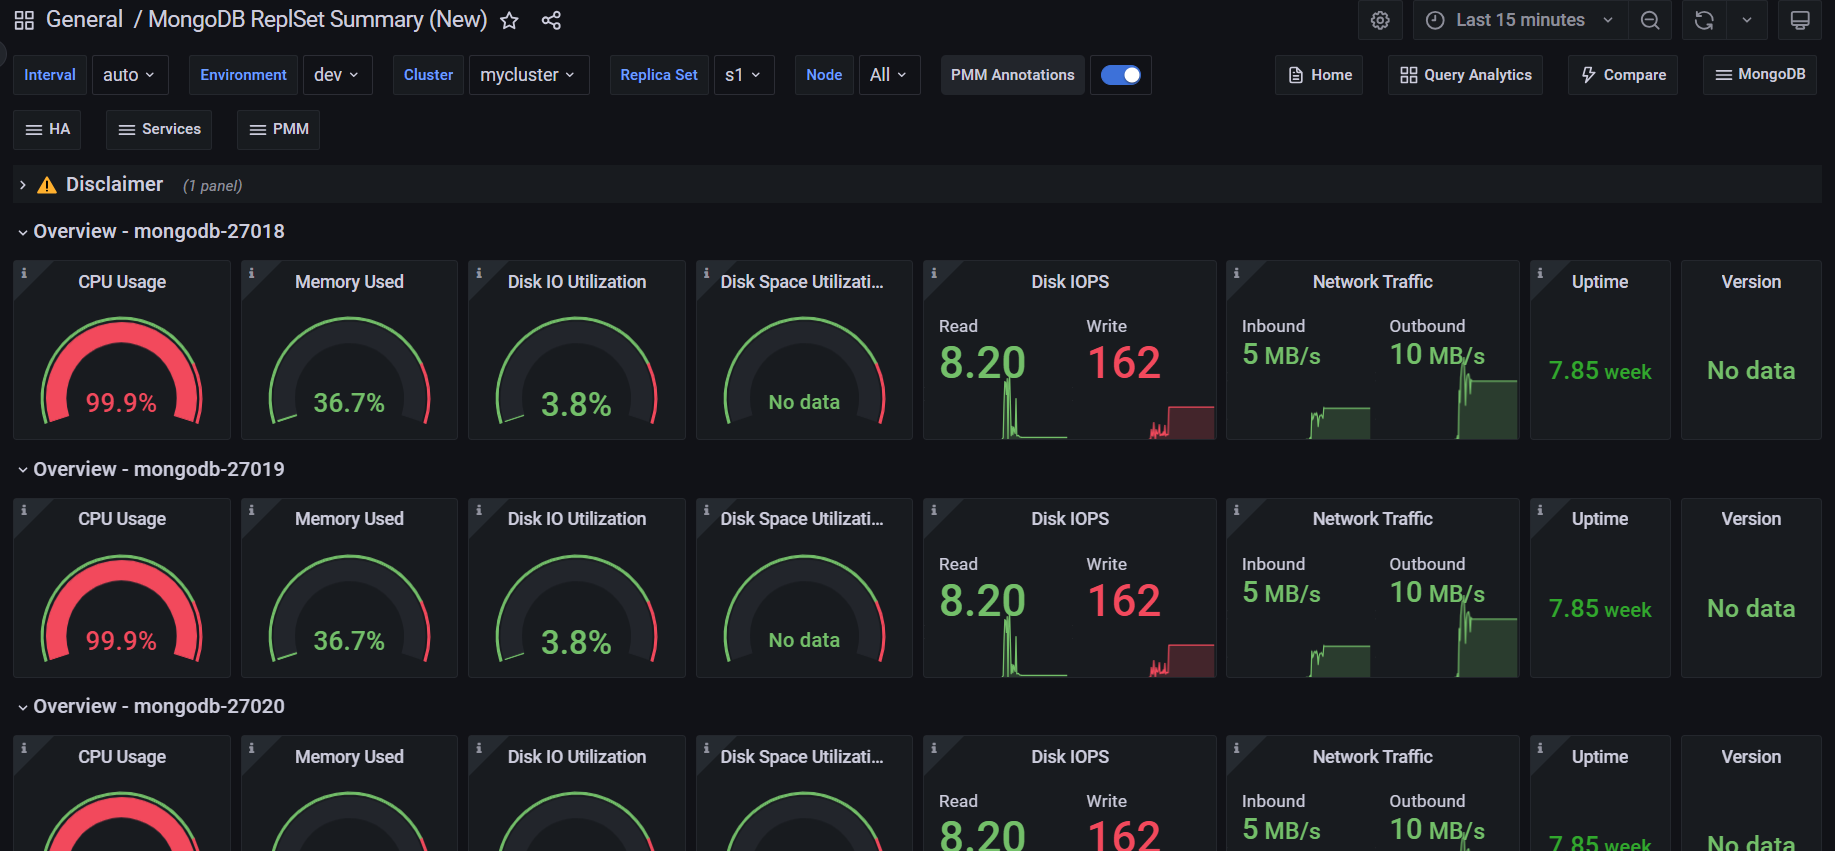
Experimental MongoDB dashboards: Sharded Cluster and Replica Set
Along with the PMM Health Dashboard, we're also introducing experimental updates to two key MongoDB dashboards: the Cluster Summary and ReplicaSet dashboards. These new versions, accessible from the MongoDB section within PMM, have been redesigned to address feedback regarding readability and data density.
The design and navigation are simplified here, to focus on the essential parameters and metrics most relevant to MongoDB performance monitoring.
We encourage you to explore these experimental dashboards and provide feedback in the PMM forum to help us refine them.
Improvements
-
PMM-3303 - We've introduced an experimental PMM Health dashboard in the Experimental folder, offering detailed insights into PMM's health and performance by covering key components such as node health, Query Analytics, Grafana, VictoriaMetrics, ClickHouse, and PostgreSQL metrics.
-
PMM-13123 - Enhanced the Query Response Time Distribution graphs in the MySQL Query Response Time Details dashboard to provide more granular insights into query performance. Previously, the graphs did not include buckets for queries with response times less than 100 milliseconds, the range which many queries typically fall into. This limitation made it difficult to analyze the performance of sub-100ms queries, especially those in the sub-1ms range.
-
PMM-13075 - Added support for Ubuntu 24.04 support.
-
PMM-12896, PMM-12895, PMM-12971 - Added per-database metrics collection and control of parameters, enabling more granular data gathering without overusing connections.
-
PMM-12994 - Added labels to the
pg_replication_slot_slot_is_activeandslot_current_wal_lsnmetrics in the postgres_exporter to identify the replication type (logical or physical) and the plugin used for the slot. -
PMM-12753 - Added experimental versions of the MongoDB Cluster Summary and ReplicaSet dashboards with a streamlined design and simplified navigation, focusing on essential metrics for monitoring MongoDB performance.
-
PMM-11583 - Added support for the
innodb_redo_log_capacityvariable introduced in MySQL 8.0, ensuring accurate and consistent data representation in the InnoDB Logging graphs. -
PMM-11278 - Improved the Query Analytics documentation to explain how QAN collects data. For more information, see the Query Analytics under the hood section in the [Query Analytics topic](https://docs.percona.com/p...
v2.41.2
Percona Monitoring and Management 2.41.2
| Release date | March 20th, 2024 |
|---|---|
| Installation | Installing Percona Monitoring and Management |
Percona Monitoring and Management (PMM) is an open source database monitoring, management, and observability solution for MySQL, PostgreSQL, and MongoDB.
It enables you to observe the health of your database systems, explore new patterns in their behavior, troubleshoot them and execute database management operations—regardless of whether your databases are located on-premises or in the cloud.
Release highlights
Debian 12(Bookworm) pmm-client packages
Starting with PMM 2.41.2, we now offer pmm-client packages for the latest version of Debian. You can install these packages by following the instructions in our documentation.
Experimental dashboards
!!! warning "warning"
These experimental dashboards are subject to change. It is recommended to use these dashboards for testing purposes only.
As part of PMM 2.41.2, we have added the following experimental dashboards.
- Reworked Kubernetes dashboards
- Databases overview dashboard
- PostgreSQL Instance Summary dashboard
- PostgreSQL Checkpoints, Buffers and WAL Usage dashboard
- PostgreSQL Patroni dashboard
To access the experimental dashboards, go to the PMM home page and then navigate to Dashboards > Experimental from the side menu.
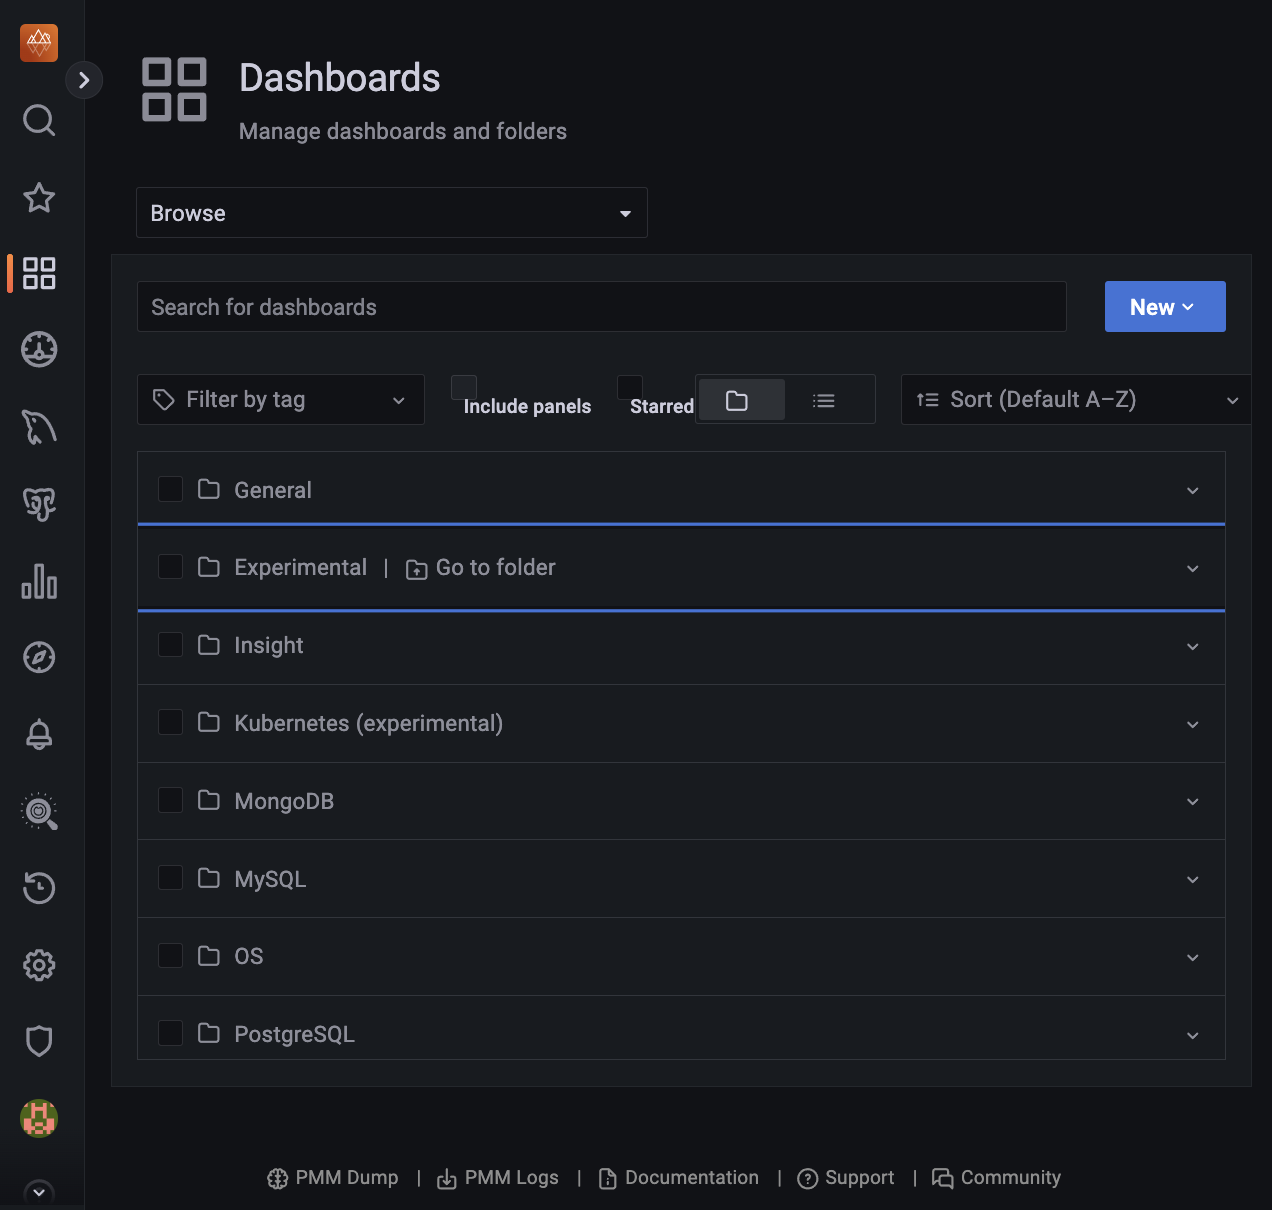
Alternatively, go to the PMM home page, navigate to Dashboards from the side menu, and enter the dashboard name in the Search for dashboards field.
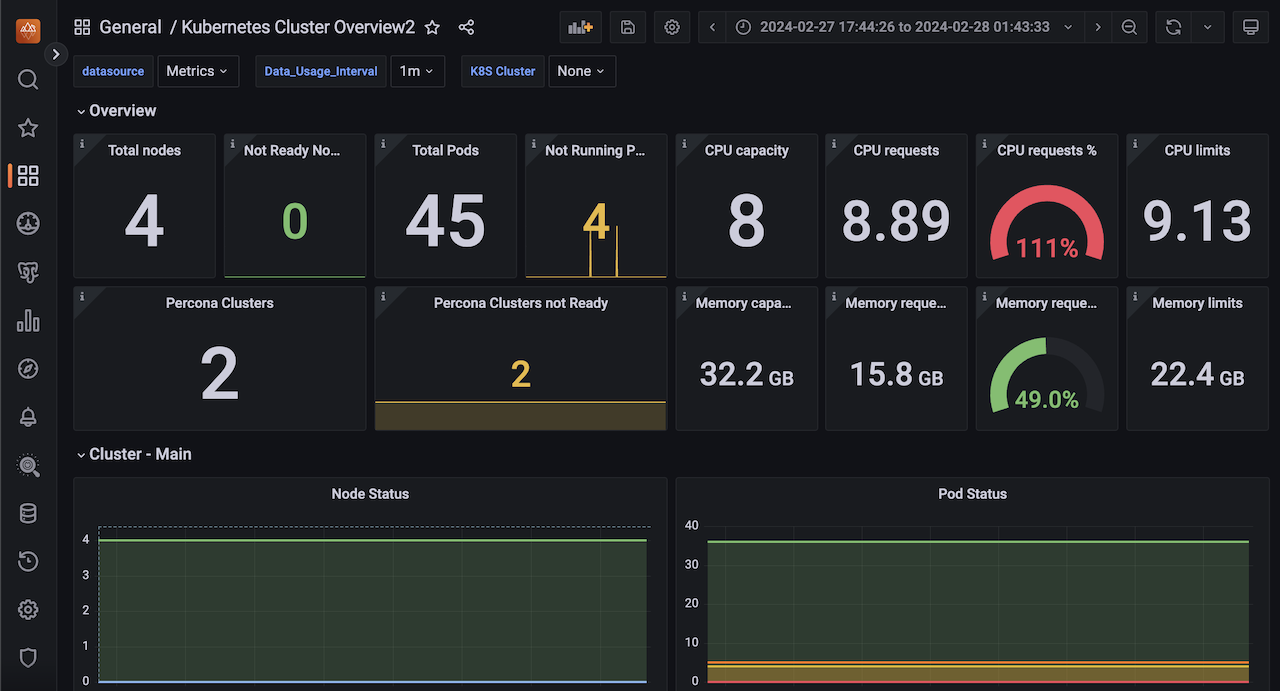
Reworked Kubernetes dashboards
PMM 2.41.2 now features redesigned Kubernetes dashboards that offer improved clarity and usability.
- The redundant information has been removed from some of these dashboards.
- The Overview dashboard, which has now been renamed as Kubernetes Cluster Overview, has been reorganized and improved for better functionality.
- The DB Cluster dashboard has been renamed as Databases on Kubernetes and now displays dynamic information. Furthermore, it separates database/proxy details and shows resource limits.
These changes aim to improve user experience while adhering to PMM standards, particularly for managing multiple clusters.
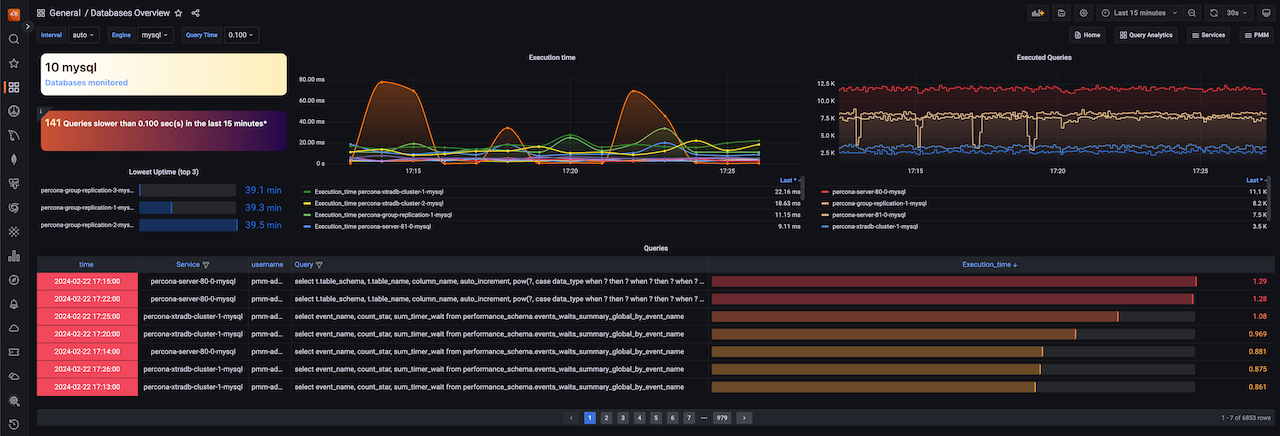
Databases overview dashboard
The latest release introduces a new dashboard that offers a simplified overview of the databases being monitored by PMM. This dashboard aims to provide a centralized and unified place where the crucial parameters for database performance can be easily accessed.
If you're looking for more information on this dashboard, see the blog post.
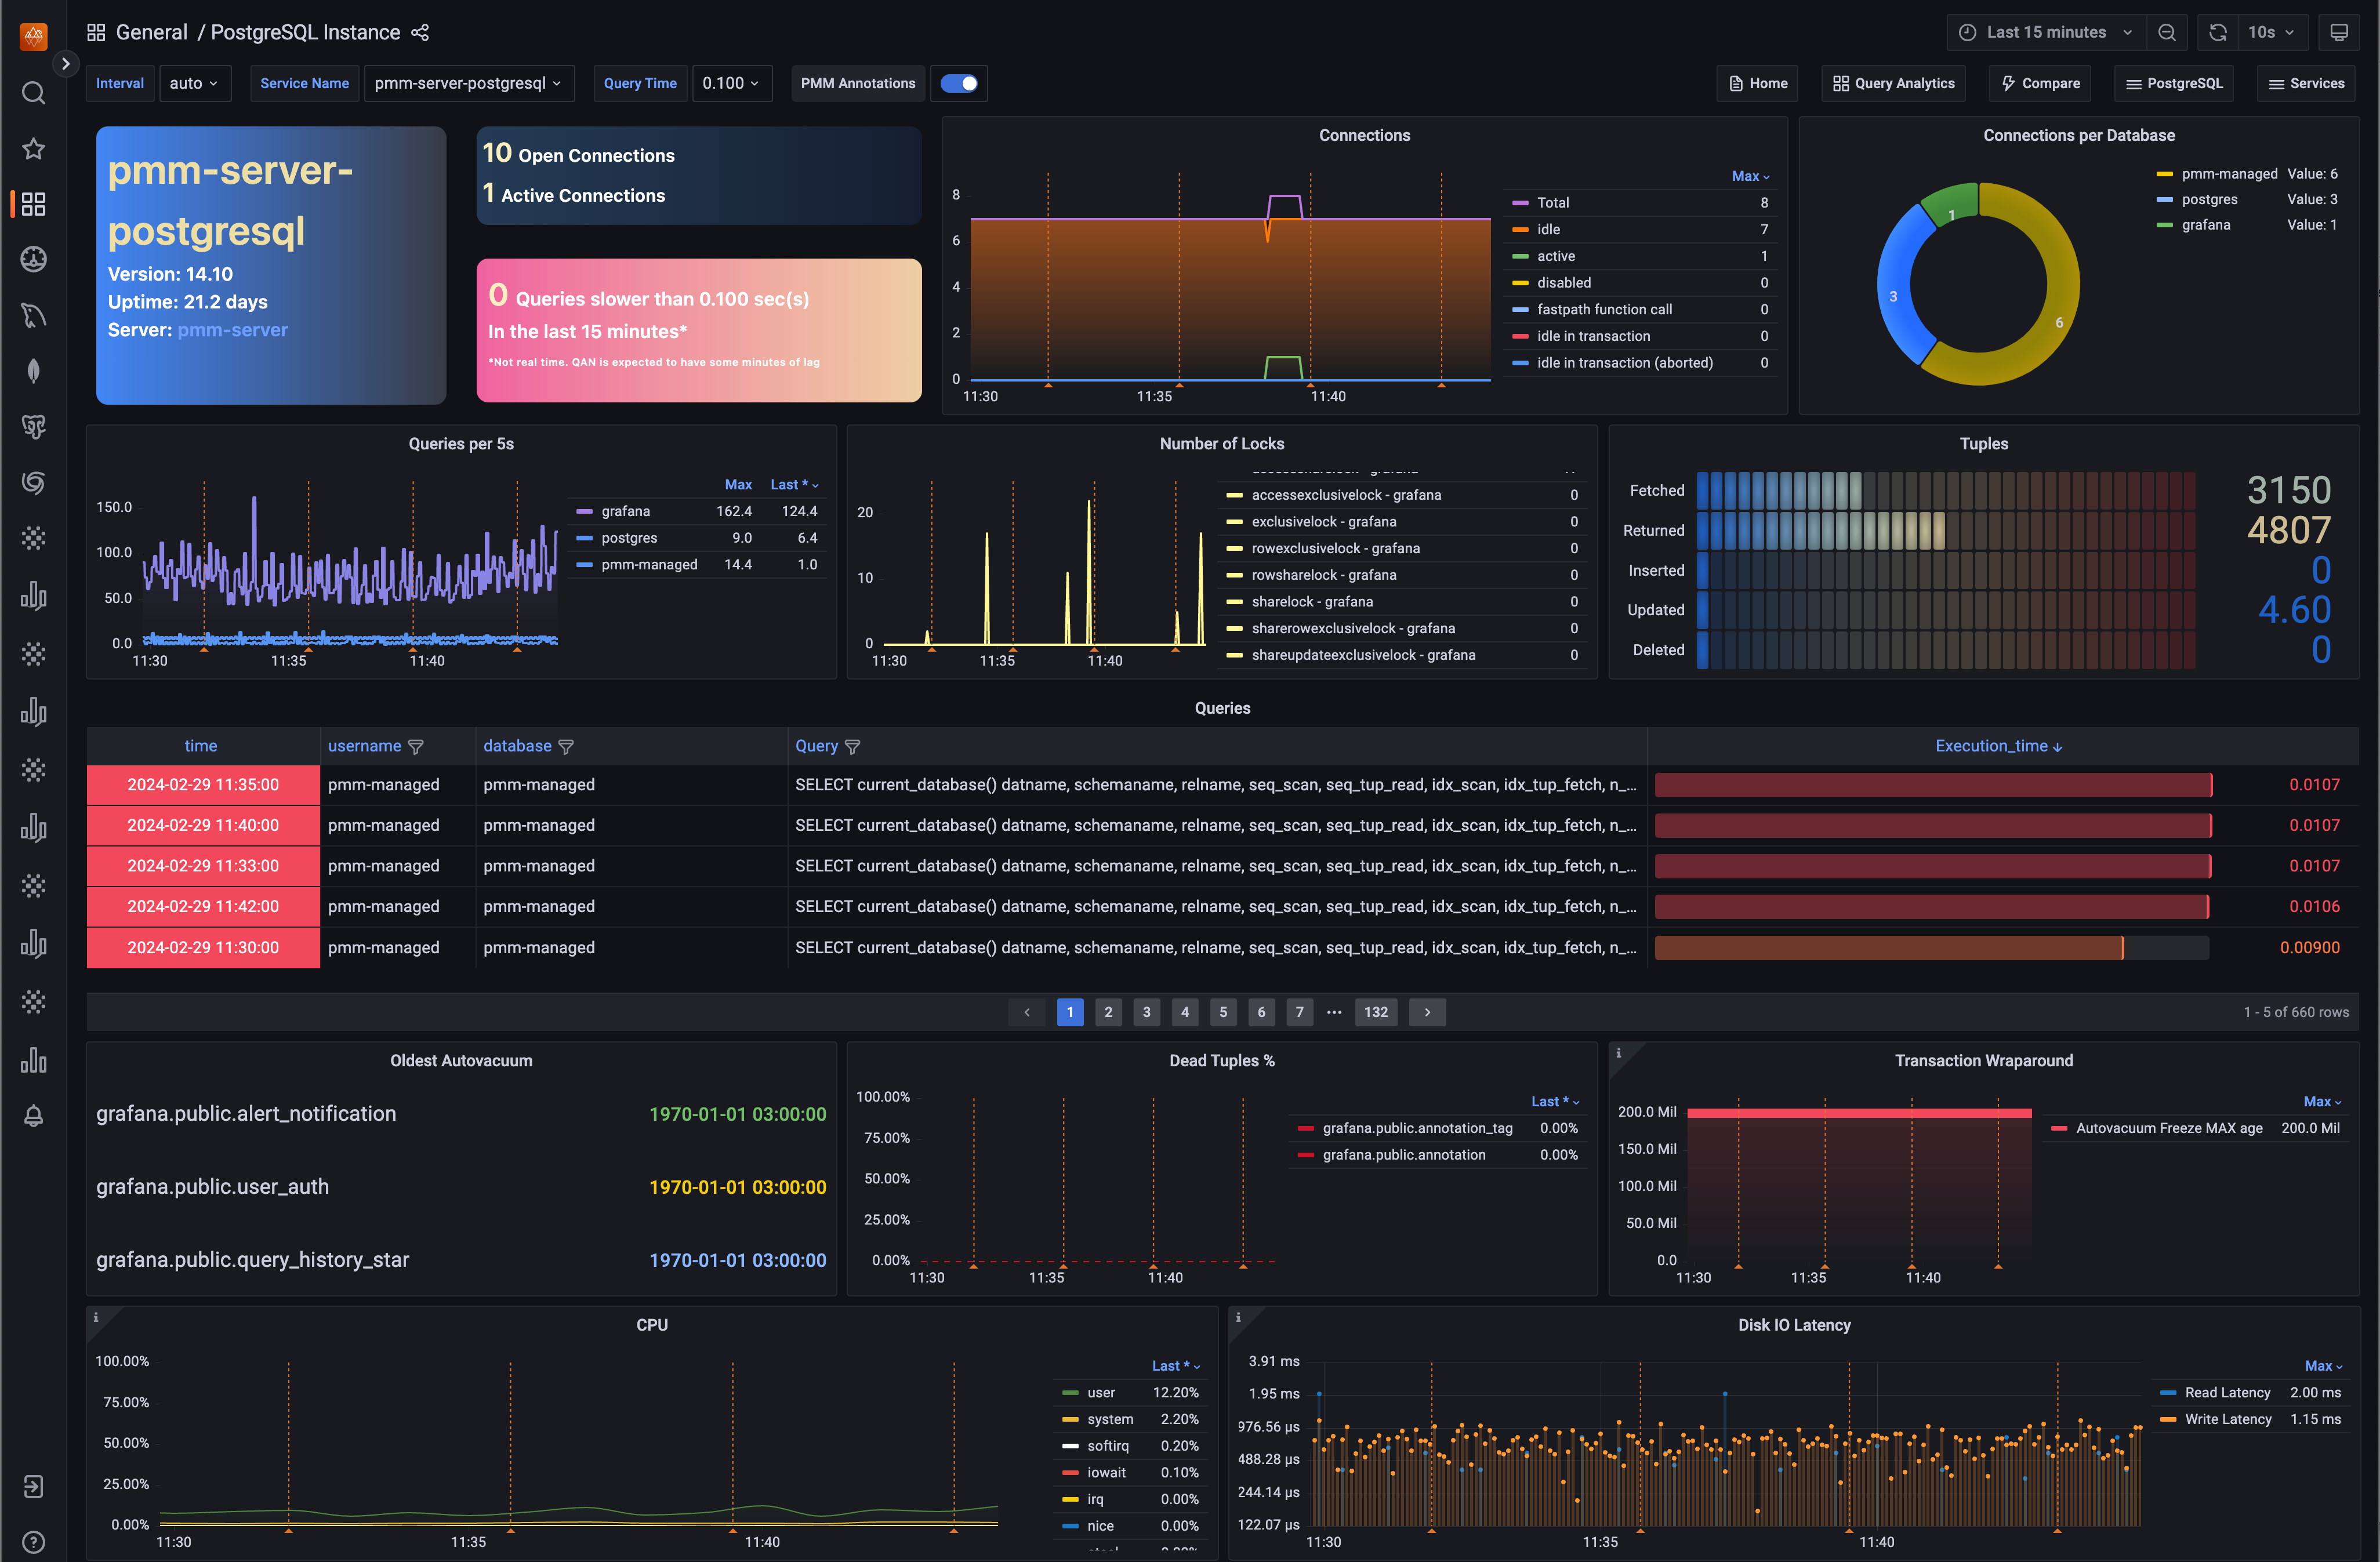
PostgreSQL Instance Summary dashboard
The PostgreSQL Instance Summary dashboard is a newly designed feature that displays the critical PostgreSQL metrics. This dashboard aims to assist DBAs and developers in identifying PostgreSQL issues quickly.
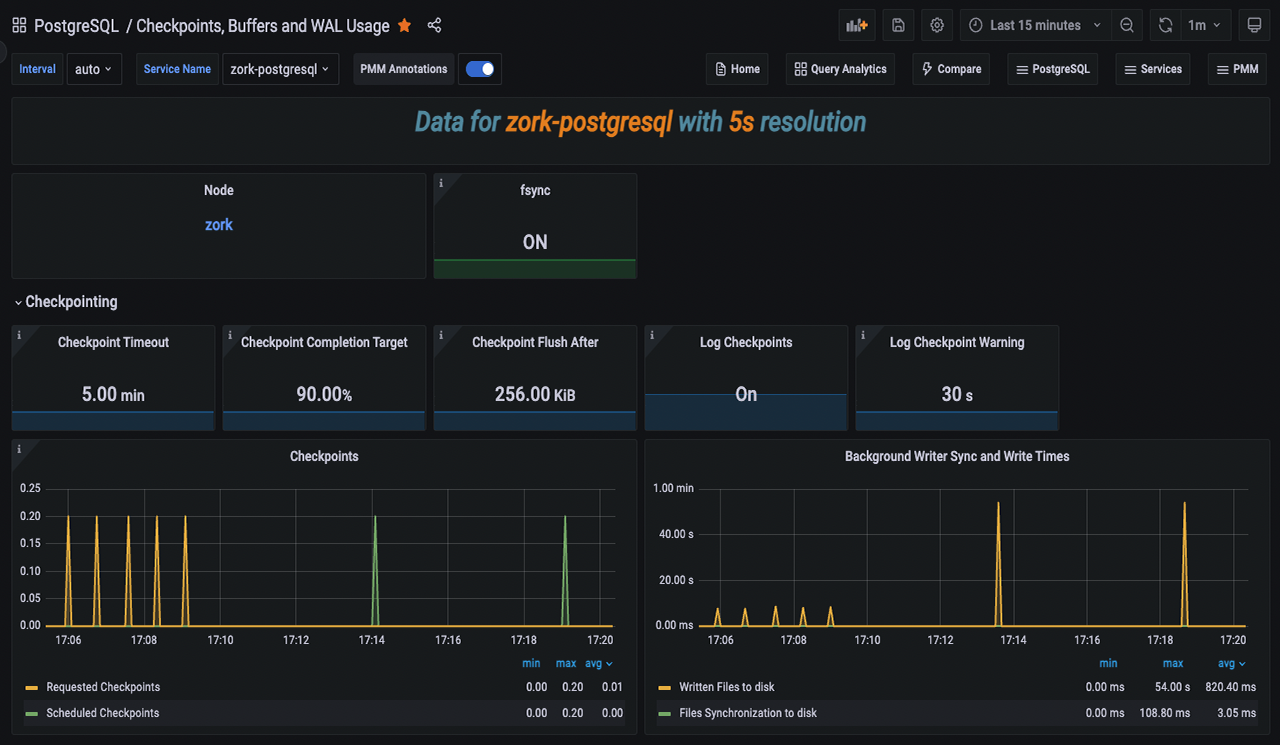
PostgreSQL Checkpoints, Buffers and WAL Usage dashboard
In our continuous effort to enhance our dashboards, we have introduced this new experimental dashboard that provides more data about your PostgreSQL instances.
By leveraging this data, administrators can gain insights into their PostgreSQL servers and fine-tune their performance. Understanding and managing checkpoints, buffers, and WAL usage contribute to a well-performing and reliable PostgreSQL environment.
If you’re looking for in-depth insights into this dashboard, refer to our blog post.
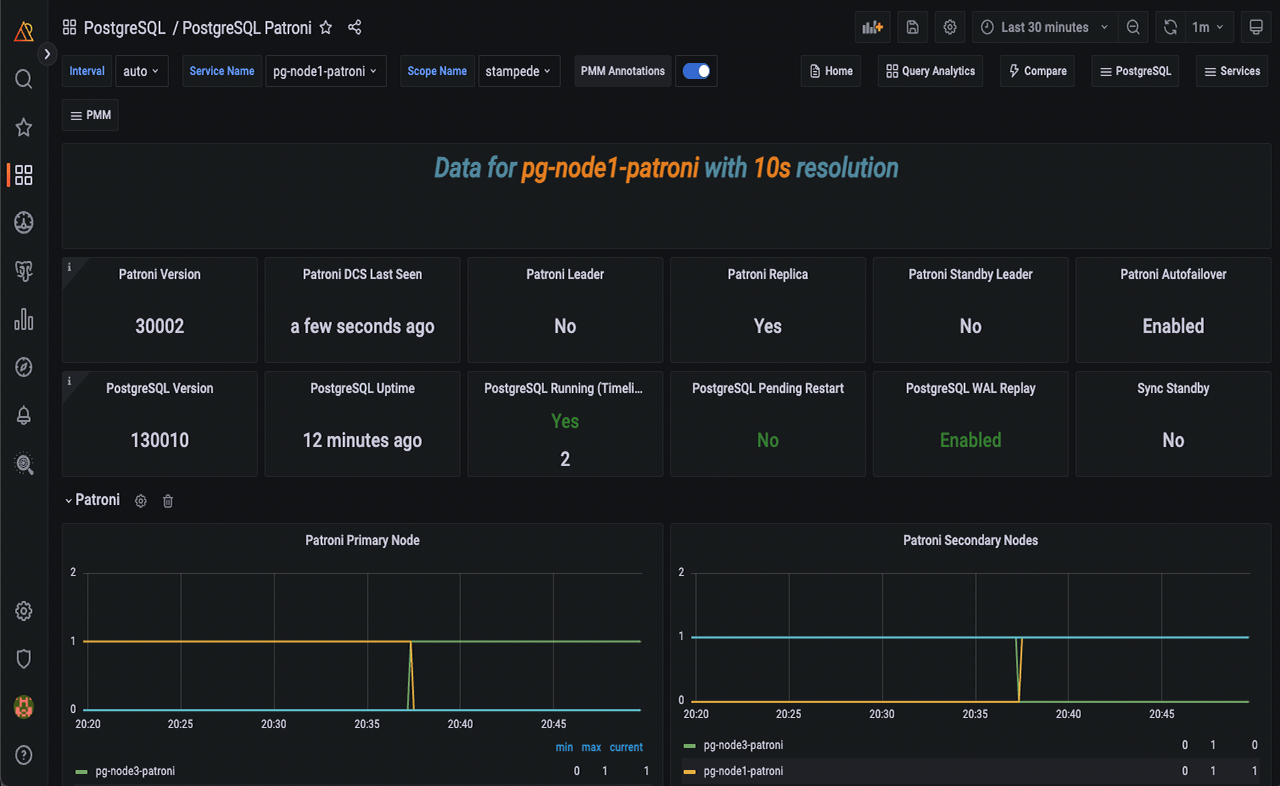
PostgreSQL Patroni dashboard
Starting with PMM 2.41.2, we have included a new dashboard designed to monitor Patroni as an external service. For more information, see our documentation on external services.
This dashboard facilitates gathering more data for your PostgreSQL cluster inside PMM.
Read our blog post to learn more about this dashboard and how to add Patroni monitoring.
⚠️ Important
We would appreciate your feedback on these experimental dashboards to help us enhance it further.
Improvements
-
PMM-10974 - Starting from PMM version 2.41.2, PMM has improved its stat tracking feature. In case
pg_stat_monitoris not available, PMM will now usepg_stat_statementsas a fallback option. -
PMM-12884 - In PMM dump, the Address field on the Send to Support screen now comes with the address and port pre-filled, making it easier to send logs to support.
-
PMM-12887 - [Tech Preview] This new experimental dashboard has been added in PMM 2.41.2 for monitoring PostgreSQL checkpoints, buffers and WAL usage.
-
PMM-12888 - [Tech Preview] This new experimental dashboard has been added in PMM 2.41.2 to monitor Patroni as an external service.
-
PMM-12960 - [Tech Preview] The latest PMM release includes redesigned Kubernetes dashboards with improved clarity and usability.
-
PMM-12981 - Starting with PMM 2.41.2, PMM can now collect wraparound metrics for PostgreSQL. By monitoring these wraparound-related metrics, PostgreSQL administrators can proactively manage wraparound risks and prevent potential data corruption and downtime.
-
PMM-12894 - We have limited the number of connections used by postgres_exporter. Additionally, we have fixed an issue where connections are closed as soon as they are no longer needed, thereby preventing any hanging or idle connections.
-
PMM-12897 - Previously, two heavy queries were running for each database in the PostgreSQL server at medium resolution, which impacted the performance. These queries have now been moved to low resolution to improve performance.
Fixed issues
-
PMM-12806 - In previous versions, PMM Server used certain non-configurable Victoria Metrics settings with default values. With this release, we are updating this behavior to enable you to modify default values for Victoria Metrics settings using environment variables. Previously, environment variables were overlooked as Victoria metrics prioritized specific command line flags passed by PMM over environment variables.
-
PMM-12348 - The ClickHouse engine was updated from the ordinary engine to the Atomic engine, which is the most robust engine, after upgrading PMM to version 2.41.0.
-
PMM-12785 - Fixed an issue where VictoriaMetrics scrape configuration contained unsupported parameters.
-
PMM-12805 - While monitoring MongoDB servers, the disk space was being consumed due to the
CommandNotSupportedOnViewmessage in the logs. This issue has now been resolved. -
PMM-12809 - Fixed several CVEs in PMM versions v2.40.1 and above.
-
PMM-12852 - An internal server error was thrown while attempting to modify any setting in PMM. This issue has been resolved now.
-
PMM-12986 - The
PostgreSQL connections in usealert was triggering false positive notifications, but the issue has been resolved now. -
PMM-12948 - Fixed an issue where the wrong information was being displayed regarding the uptime of the PostgreSQL instance.
-
PMM-12997 - The
pmm-agentoutput was changed fromstdouttostderr, which caused the automation to break. The issue has been resolved now.
v2.41.1
Percona Monitoring and Management 2.41.1
| Release date | Feb 1st, 2024 |
|---|---|
| Installation | Installing Percona Monitoring and Management |
Percona Monitoring and Management (PMM) is an open source database monitoring, management, and observability solution for MySQL, PostgreSQL, and MongoDB.
It enables you to observe the health of your database systems, explore new patterns in their behavior, troubleshoot them and execute database management operations—regardless of whether your databases are located on-premises or in the cloud.
Release Highlights
Improved support for Arbiter nodes
We've made it easier to add and monitor MongoDB Arbiter nodes in PMM, as this no longer requires workarounds for cases where authorization is enabled on the MongoDB replica set. Additionally, Arbiter nodes are now displayed correctly on the dashboards:

New metric for sharded MongoDB insights
We've added a new metric to our MongoDB exporters: mongodb_shards_collection_chunks_count. This metric is available for sharded Mongo instances, offering insights into the distribution of collection chunks across different shards.
While this version is not currently integrated into any dashboard, you have the flexibility to incorporate it into your custom dashboards. For comprehensive instructions on managing dashboards, check out this video tutorial and the documentation.
New experimental MongoDB Instance Summary dashboard
This release also introduces a new MongoDB dashboard that offers a simplified view of the most critical MongoDB metrics. You can find the new MongoDB Instance Summary dashboard in the Experimental folder of your PMM installation. This dashboard is currently in Technical preview so we encourage you to evaluate its performance with your MongoDB instance and share your valuable feedback on our forum.
Improvements
- PMM-12390 - [Backup Management]: The Service name field on the Create Backup pages is now case-insensitive, allowing for more comprehensive and accurate results retrieval.
- PMM-12712 - MongoDB sharded cluster metrics now include a new metric to represent database and collection distribution across different shards. This helps gain insights into the overall balance of shards within MongoDB setups.
- PMM-12510 - Improved workflow for adding MongoDB Arbiter nodes to PMM, which also ensures that Arbiter nodes are now displayed correctly on the dashboards.
- PMM-12750 - [Dashboards]: Introduced an experimental MongoDB Instance Summary dashboard to provide a rapid overview of key MongoDB metrics.
- PMM-12866 - [Dashboards]: Minor UX improvements to the K8s experimental dashboard (Tech Preview).
Bugs Fixed
- PMM-12652 - Fixed issue where PMM failed to start after an upgrade, due to SELinux restrictions on accessing a PMM file created with root ownership on Podman. This fix applies to upgrades from PMM 2.41.0 to newer versions.
- PMM-9825 - [QAN]: PostgreSQL databases, monitored using the pg_stat_monitor extension v2.0+, were previously displayed with User IDs rather than actual User Names in the Service Name column on the Query Analytics (QAN) page. This issue is now fixed.
- PMM-12290 - [QAN]: Fixed bugs with SQL comments parsed in queries when they were not intentionally enabled for remotely added PostgreSQL and MySQL.
- PMM-12621 - [Dashboards]: Added support for the Anonymous mode to show all Service types on the main menu. This ensures users can access the dashboards, even when PMM is configured in Anonymous mode.
- PMM-12425 - [QAN]: The Absolute time range time picker on the Query Analytics (QAN) page no longer displays an error when using 'now' instead of a specific timestamp for filtering dashboard data.
- PMM-12473 - Fixed monitoring of external services when query string parameters are passed to
--metrics-path. - PMM-9407 - Fixed missing custom
queries.yamlfile for medium-resolution in Debian packages for PostgreSQL. - PMM-12350 - Fixed issue of flood logs in
mongod_exporterwhen connected to Mongos. - PMM-12738 - Fixed issue that prevented PMM from running when using Helm with customer certificates.
- PMM-12781 - Corrected a permission error that was flooding PostgreSQL logs by ensuring proper execution permissions for the
pg_ls_waldirfunction.
v2.41.0
Percona Monitoring and Management 2.41.0
| Release date | Dec 12, 2023 |
|---|---|
| Installation | Installing Percona Monitoring and Management |
Percona Monitoring and Management (PMM) is an open source database monitoring, management, and observability solution for MySQL, PostgreSQL, and MongoDB.
Release Highlights
Streamlined database problem reporting to Percona
To improve the gathering and sharing of PMM metrics and data, we’ve now integrated the pmm_dump client utility into PMM. Initially a standalone client for PMM Server, PMM Dump is now accessible in the PMM user interface.
This integration enables you to collect PMM data to share with our Support team.
To get started, in the main menu, go to Help > PMM Dump and select either to export a dataset locally or upload it to our SFTP servers using the credentials generated through your Percona Support ticket.
PostgreSQL monitoring: optimizing performance
PMM 2.41.0 introduces limit for Auto-discovery in PostgreSQL, a feature that dynamically discovers all databases in your PostgreSQL instance. Limiting Auto-discovery reduces connections and prevents high CPU and RAM usage caused by multiple databases, thus optimizing performance.

For details, see documentation.
PMM DBaaS functionality evolution into Percona Everest
We have decided to separate our DBaaS offering into an independent product. Consequently, we are discontinuing the DBaaS functionality in PMM and offering a migration path to Everest.
While the DBaaS functionality will remain available in PMM versions 2.x, all future updates and enhancements will be exclusively accessible through the Percona Everest interface.
For a more streamlined and robust database deployment experience, try Percona Everest.
Technical Preview of PMM in high availability (HA) mode
⚠️ Important
Disclaimer: This feature has been added in PMM 2.41.0 and is currently in Technical Preview. Early adopters are advised to use this feature for testing purposes only as it is subject to change.
Starting with this release, PMM can now be run in high availability mode with several PMM server applications and independent data sources.
Currently, PMM servers provide high availability, but users are responsible for maintaining the high availability of the data sources used by PMM.
These data sources are:
- ClickHouse: An open-source, fast analytical database.
- VictoriaMetrics: A scalable, long-term storage solution for time series data.
- PostgreSQL: A powerful open-source relational database management system used in this setup to store PMM data like inventory, settings, and other feature-related data.
If you're looking to dive deep into this feature, see our comprehensive documentation.
New Features
- PMM-12459 - The pmm_dump client utility previously available as a standalone client for PMM Server is now readily accessible within the PMM user interface.
Improvements
- PMM-11341 - PMM 2.41.0 introduces limit for Auto-discovery in PostgreSQL, a feature that dynamically discovers all databases in your PostgreSQL instance. Limiting Auto-discovery reduces connections and prevents high CPU and RAM usage caused by multiple databases, thus optimizing performance.
- PMM-12375 - Starting with PMM 2.41.0, each instance of a service gets a
versionattribute in the PMM Inventory UI. - PMM-12422 - PMM 2.41.0 introduces a new flag called
--expose-exporter. When you enable this flag any IP address, either from a local system or from anywhere on the internet, can access exporter endpoints. If the flag is not enabled, the exporter will be available only locally. - PMM-12544 - Added deprecation notices to the PMM documentation DBaaS pages. For a more streamlined and robust database deployment experience, try Percona Everest.
- PMM-12549 - Added support for the latest MongoDB version. You can now use PMM to monitor MongoDB 7 databases.
Components upgrade
- PMM-12154 - Updated
postgres_exporterto version 0.14.0. With this update, we have resolved several performance issues and eliminated the creation of multiple connections per database. - PMM-12223 - Clickhouse has been updated to version 23.8.2.7, which optimizes memory and CPU usage to improve system performance.
Bugs Fixed
- PMM-4712 - We have addressed the issue where the pprof heap reports for postgres_exporter were missing.
- PMM-12626 - Due to the packages being built on an outdated Go version, there was a potential vulnerability. We have updated Go to the latest version to mitigate this risk.
- PMM-12414 - Fixed an issue with an unexpected behavior (502 response) when accessing the
logs.zipendpoint. This was caused by thegroup_byparameter being included in the Alertmanager configuration. Additionally, we removed AlertManager-related files fromlogs.zipsince we stopped using AlertManager. - PMM-11714 - Registering a node with the Grafana Admin flag enabled but a non-admin role was failing. This issue has now been resolved.
- PMM-12660 - Prior to version 2.41.0 of PMM, the endpoint
/v1/management/Agent/Listcould deliver database certificates to the PMM UI, allowing an authenticated admin user to view the output of TLS certificates. This posed a security issue since certificates should be consumed by the backend only. We have resolved this issue now. - PMM-12630 - When users attempted to upgrade PMM versions lower than or equal to 2.37.1, the upgrade process got stuck in a loop and failed. The issue has been resolved now.
- PMM-12725 - Fixed the pagination for QAN.
- PMM-12658 - Corrected a typo in the MongoDB cluster summary dashboard.
v2.40.1
Percona Monitoring and Management 2.40.1
| Release date: | Oct 20, 2023 |
|---|---|
| Installation: | Installing Percona Monitoring and Management |
Percona Monitoring and Management (PMM) is an open-source database monitoring, management, and observability solution for MySQL, PostgreSQL, and MongoDB.
Fixed issues
- PMM-12592 - Fixed an issue where the Library Panels for the PMM dashboard were not working after upgrade to PMM 2.40.0.
- PMM-12576 - After upgrading to PMM 2.40.0, changing the Admin user's password from the terminal was not functioning. The issue has been resolved now.
- PMM-12587 - After upgrading to PMM 2.40.0, some users may experience incorrect mappings between dashboards, folders, users, and groups. This can result in either a successful upgrade or a
500 internal server error. The issue has now been resolved. - PMM-12590 CVE-2023-4911 is a vulnerability in the base OS that PMM is based on. It has been fixed in the base OS, and the fix is available in PMM.
How to upgrade to PMM 2.40.1
For instructions on upgrading to PMM 2.40.1 and mitigating issues from PMM 2.40.0, follow the steps below:
-
Copy the file from
/srv/backup/grafana/grafana.dbto/srv/grafana/grafana.dbdocker exec -t pmm-server cp /srv/backup/grafana/grafana.db /srv/grafana/grafana.db -
Set permissions:
chmod 640 /srv/grafana/grafana.db

chown grafana:grafana /srv/grafana/grafana.db
-
Upgrade to 2.40.1 as usual.
v2.40.0
Percona Monitoring and Management 2.40.0
| Release date: | Oct 05, 2023 |
|---|---|
| Installation: | Installing Percona Monitoring and Management |
Percona Monitoring and Management (PMM) is an open source database monitoring, management, and observability solution for MySQL, PostgreSQL, and MongoDB.
Release Highlights
Inventory improvements
Ability to update labels for existing services to PMM
Starting with PMM 2.40.0, editing labels for existing services is easier and much more efficient. You can edit a service label directly from the PMM UI without removing and re-adding it. For more information on editing labels, see documentation.

Furthermore, in our continued effort to enhance user experience, we have redesigned the following pages to make them more user-friendly and intuitive:
- Select service type page
- Add service page
Connecting Services and Nodes
Starting with PMM 2.40.0, you can click on the link in the Node Name column to view the node on which a specific service is running and analyze how node-level resource utilization impacts the performance of those services.
Before introducing this feature, locating the running services on a node was cumbersome. However, with this new feature, you can effortlessly access a list of services running on a specific node and identify the node name where the service is being utilized. Additionally, the filters implemented make navigation a lot simpler.

Furthermore, you can also see the service running on that specific node when you click on the link in the Services column.

Cluster view for Inventory
⚠️ Important
This feature is still in Technical Preview and is subject to change. We recommend that early adopters use this feature for evaluation purposes only.
Understanding the structure of your inventory is crucial. With the release of PMM 2.40.0, we've introduced an experimental feature that categorizes all your Services by Cluster, making it easier for you to understand your inventory. By using the Organize by Clusters toggle, you can view a group of services as a single cluster. PMM utilizes the cluster label to display services that belong to the same cluster.

For detailed information on this feature, see documentation.
MongoDB Backup Monitoring
With this release, we are shipping the first version of a the Backup failed alert template which notifies of any failed MongoDB backups. This uses a new, dedicated metric, pmm_managed_backups_artifacts, for checking the state of backup artifacts.
This new template is currently in Technical Preview and we are keen to get your feedback around this change before we move it to General Availability.

For information on working with this new template, see the Percona Alerting topic.
Components Upgrade
VictoriaMetrics has been upgraded v1.93.4.
New Features
- PMM-11963 - Starting with PMM 2.40.0, you can click on the link in the Node Name column to view the node on which a specific service is running.
- PMM-11148 - [Inventory]: We have redesigned the Select service type and Add service pages to make them more user-friendly and intuitive.
- PMM-11423 - [Inventory]: Starting with PMM 2.40.0, you can now edit service labels directly from the PMM UI without having to remove and re-add them.
- PMM-12378 - [Inventory]: We have introduced an experimental feature that categorizes all your Services by Cluster, making it easier for you to understand your inventory. By using the Organize by Clusters toggle, you can view a group of services as a single cluster.
- PMM-12384 - [Alerting]: Added a new built-in alert template, Backup failed which you can use to create alert rules that notify of failed MongoDB backups.
- PMM-9374 - [Technical Preview]: Starting with PMM 2.40.0, you can now use an external VictoriaMetrics database for monitoring in PMM. This provides multiple benefits, including scalability, resource isolation, reduced load on the PMM server, customization, etc.
Improvements
- PMM-4466 - Grafana now uses PostgreSQL instead of SQLite, resulting in improved performance, stability for user auth requests, data integrity, reliability, security, etc.
- PMM-12310 - Links from PMM to documentation may change, causing "broken links" in older PMM versions due to document structure changes. We have replaced all links with Short.io links specific to each document to address this. This way, we can maintain the PMM-to-doc links using a URL shortener. This ensures that the links remain accessible even if the document structure changes.
- PMM-12457 - We have added a new
node_nameproperty to the PMM agent down alert template in PMM. This allows users to easily identify the node where the failure occurred. - PMM-12488 - VictoriaMetrics has been updated to v1.93.4.
- PMM-12500 - [Technical Preview]: For Percona Operator users, we have introduced a new dashboard for K8s monitoring with PMM 2.40.0.
- PMM-11770 - PMM now automatically sets the server domain value in
grafana.inito the public address specified in PMM’s Advanced Settings. This ensures that links generated by Grafana, such as links in alert emails, also carry that address.
Bugs Fixed
- PMM-10145 - When we installed an AMI image in AWS and added an Amazon RDS instance in the creating state, it caused errors. The issue has been resolved now.
- PMM-12173 - On adding several clients to PMM, unexpected and unauthorized errors caused PMM to stop responding. The issue has since been resolved now.
- PMM-12344 - An error was displayed on the Explain tab after selecting a PostgreSQL query. The issue has been resolved now.
- PMM-12361 - The command
pmm-admin inventoryreturned GO errors. The issue has been reolved now. - PMM-12382 - Fixed an issue where the upper-case custom labels were not being accepted.
- PMM-11371 - Usage of
pmm-adminconfig subcommand shutdown pmm-agent. The issue has been resolved now. - PMM-11603 - When running
pmm-agentoutside of systemd, adding an agent causes errors. The issue has been resolved now. - PMM-11651 - When a user has both full access and limited access roles, only the limited role's metrics are displayed. The issue has been resolved now.
- PMM-12146 - Dead Tuples graph on PostgreSQL Vacuum Monitoring Dashboard displayed invalid percentage. The issue has been resolved now.
- PMM-12448 - Can't start backup if artifact with empty
service_idexists.
Known issue
- PMM-12517 - If you have set custom dashboards as your Home dashboard in version 2.26.0, they may be lost after upgrading to version 2.40.0. To prevent this, we recommend that you back up your custom dashboard before upgrading and recover it after the upgrade.
v2.39.0
Percona Monitoring and Management 2.39.0
| Release date: | Aug 14, 2023 |
|---|---|
| Installation: | Installing Percona Monitoring and Management |
Percona Monitoring and Management (PMM) is an open source database monitoring, management, and observability solution for MySQL, PostgreSQL, and MongoDB.
Release Highlights
MongoDB backups: UI-based restore on a new replica set cluster
Building on the recent MongoDB backup management enhancements, we have now added the option to restore backups on different clusters with the same configuration. This enables you to test restore data before deploying it on Dev environments.
Restoring on different clusters is not available for sharded clusters. This is a complicated process that still requires manual intervention. For more information, see Restoring from a sharded cluster
Query Analytics - Meta information
QAN is an important tool that can help filter data and identify problematic queries. However, it can be challenging to determine which services, nodes, and other labels are linked to these queries.
PMM 2.39.0 now includes a metadata table for QAN to address this issue. This table contains information such as Node name, Node name, Service name, Service type, and user name for each selected query. With this feature, you can easily identify the services, nodes, and labels associated with your identified queries.
To view the metadata table, navigate to the Main menu and click on Query Analytics (QAN). This will bring you to the Query Analytics page. Next, select the desired query and expand the Metadata tab. The metadata for that specific query will then be displayed.

Improvements
- PMM-6279 - [QAN]: PMM 2.39.0 now includes a metadata table for each query. This table contains information such as Node name, Node name, Service name, Service type, and user name for each selected query.
- PMM-10270 - [Backup Management]: Enhanced MongoDB Backup Management to support restoring to different replica set clusters with the same configuration.
- PMM-11999, PMM-12257 - [Advisors] - The Advisors page now contains a new Technology column that shows the database type for each advisor. This helps you distinguish between MongoDB, MySQL, and PostgreSQL advisors.
- PMM-11206 - [Alerting]: You can now easily add multiple Alert rule templates at once, whether through the API or UI. When added in bulk, each template will be displayed separately on the Alert rule templates page. This makes it quicker and more efficient to manage your alert rules.
- PMM-11637 - PMM UI now reflects the new PMM logo as per the new branding.
- PMM-12070 - We have updated the deprecated Boomtable plugin to the Grafana table plugin.
- PMM-12389 - The postgres_exporter now provides more comprehensive logs that display the specific namespace and error message for any issue.
Bugs Fixed
- PMM-12151 - [QAN]: The Explain plan was not displayed in a few scenarios. The issue has been resolved now.
- PMM-11658 - Fixed issue that caused the pmm-agent to crash on AMI and OVF distributions.
- PMM-11992 - Postgres databases with names other than Postgres could not be added. The issue has been resolved now.
- PMM-12263 - On the MongoDB Cluster Summary dashboard, the Replication Lag by Set graph showed the wrong value if rs was in the primary-secondary-arbiter (PSA) configuration. It calculated the arbiter's lag from the beginning of the UNIX time (currently >54 years instead of a few seconds). The issue has been resolved now.
- PMM-12280 - Fixed an issue where the Service Summary Panel on Home Dashboard used the incorrect units to display
Available Memory. - PMM-10665 - Fixed issue that caused QAN to show incorrect values when setting non-default values for performance schema. Make sure to restart pmm-agent after changing the settings for perfschema in MySQL.
- PMM-10391 - PMM did not work with external Clickhouse versions greater than 22.5.2. The issue has been resolved now.
- PMM-12231 - In the recent versions of PMM, users have encountered issues with installing, updating and removing plugins from PMM. For more information on this issue, see Troubleshooting Plugin issues.
v2.38.1
Percona Monitoring and Management 2.38.1
| Release date: | July 13, 2023 |
|---|---|
| Installation: | Installing Percona Monitoring and Management |
Percona Monitoring and Management (PMM) is an open-source database monitoring, management, and observability solution for MySQL, PostgreSQL, and MongoDB.
Fixed issue
PMM-12293 - The upgrade to Grafana 9.2.20 in PMM 2.38 fixed critical security CVE-2023-3128 by changing the authentication mechanism to rely solely on the user's unique ID provided by the identity provider.
This change caused an authentication issue for second and subsequent connections to PMM using a Percona Account. With this PMM update, we are fixing this authentication issue to ensure that users can log back into PMM after an initial connection. Previously, this would fail with a "User already exists" error.
If you are using a third-party authentication provider and continue to see this issue, pass the GF_AUTH_OAUTH_ALLOW_INSECURE_EMAIL_LOOKUP=1 environment variable to the PMM container.
Alternatively, set the oauth_allow_insecure_email_lookup config key in the auth section of the grafana.ini file. Keep in mind that any changes you make to this file are lost when upgrading PMM, so make sure to manually update this file after each upgrade.
v2.38.0
Percona Monitoring and Management 2.38.0
| Release date: | Jul 3, 2023 |
|---|---|
| Installation: | Installing Percona Monitoring and Management |
Percona Monitoring and Management (PMM) is an open-source database monitoring, management, and observability solution for MySQL, PostgreSQL, and MongoDB.
Release Highlights
Important security updates
Oracle Linux 9 as new base OS for PMM
As security is paramount to us, PMM 2.38.0 adds a solid and modernized enterprise-grade foundation to PMM. This release migrates our base operating system on which we build our PMM image from CentOS 7 to Oracle Linux 9.
Thus, starting with PMM 2.38.0, PMM is publicly available on Oracle Linux 9.
This transition brings many benefits:
- a large number of CVEs automatically fixed
- improved upstream response time to security-related issues
- better compatibility with new technologies
- modern libraries for our team to build on
Since not all users will be able to seamlessly make the move, we will be rolling this out in phases:
Automated migration paths
The following users will be able to take advantage of this immediately:
-
New installations of PMM:
- Docker containers from our Docker hub:
percona/pmm-server:2 - OVF: Download directly from our website
- AMI: Loaded from AWS Marketplace
- Docker containers from our Docker hub:
-
Docker/Podman users who do full container replacement upgrades to newer versions of PMM.
Your existingdocker pullordocker runcommands will use the new image.
Manual upgrade options
If you are upgrading through the UI’s Upgrade Now button, you'll have to wait a little longer for an automated migration path. This includes:
- Docker users that use UI upgrade
- AMI users
- OVF users
If you want to upgrade manually in the meantime, check out the instructions in the PMM is getting a modernized enterprise-grade foundation blog post.
Grafana upgrade
PMM now uses Grafana to 9.2.20, which fixes some critical vulnerabilities. For more information, see Grafana's release blog.
Exporters
Updated the mysqld_exporter, node_exporter, postgres_exporter, and mongo_exporter to fix the CVEs.
ClickHouse plugin
We have migrated from the Altinity Clickhouse datasource to the Grafana Clickhouse datasource due to the vulnerabilities discovered.
Due to this migration, we have also updated our experimental Environment Overview Dashboard.
⚠️ Important
Though we have removed the datasource from PMM, we are still reusing the same name (ClickHouse) to keep the changes minimal. Thus, if you are using the old datasource in your dashboards, ensure that you upgrade the underlying queries that will pull the data from the new datasource.
Example
The following example shows the difference in the query before and after migration.
Before migration:
// Altinity ClickHouse datasource
SELECT $timeSeries as t,
    sum(m_query_time_sum)/sum(m_query_time_cnt) as QLatency,
    environment
FROM $table
WHERE $timeFilter and environment != ''
GROUP BY t,environment
ORDER BY t
After migration:
// Grafana ClickHouse datasource
SELECT period_start as t,
    sum(m_query_time_sum)/sum(m_query_time_cnt) as QLatency,
    environment
FROM pmm."metrics"
WHERE $__timeFilter(period_start) AND environment != ''
GROUP BY t, environment
ORDER BY t
Altinity data sources used macros like $timeSeries, $timeFilter, and $table, which are no longer present in the Grafana datasource. As a result, the query needs to be rewritten to use the new macros instead of the old ones.
You will notice that in the example above, the macro $timeFilter has changed to $__timeFilter, and now it requires a parameter, which should be a column of type datetime.
Depending on which macros you have used, your migration effort will vary. However, we recommend checking the plugin documentation to apply the new syntax correctly, including macros and template variables.
Improved nodes view on the Inventory page
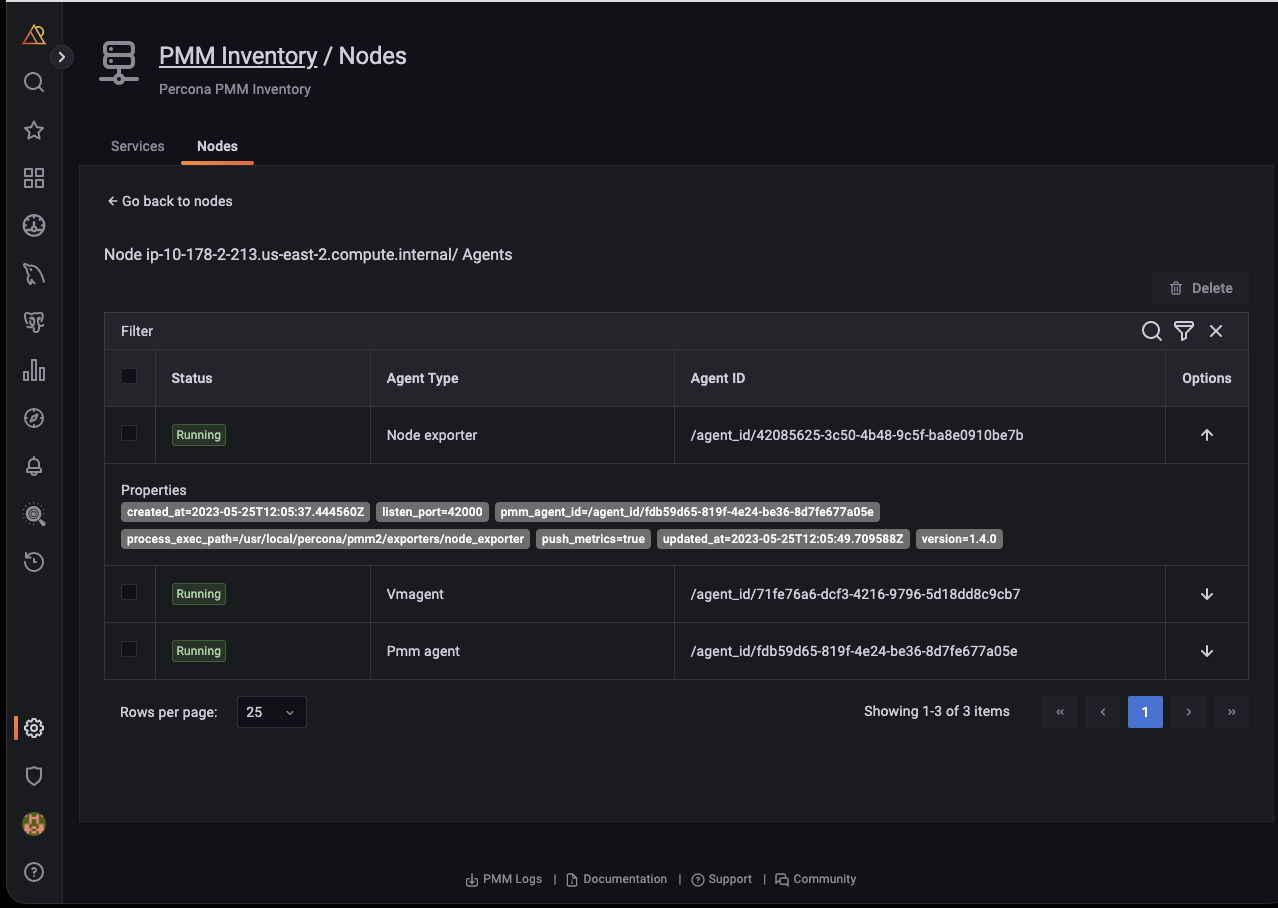
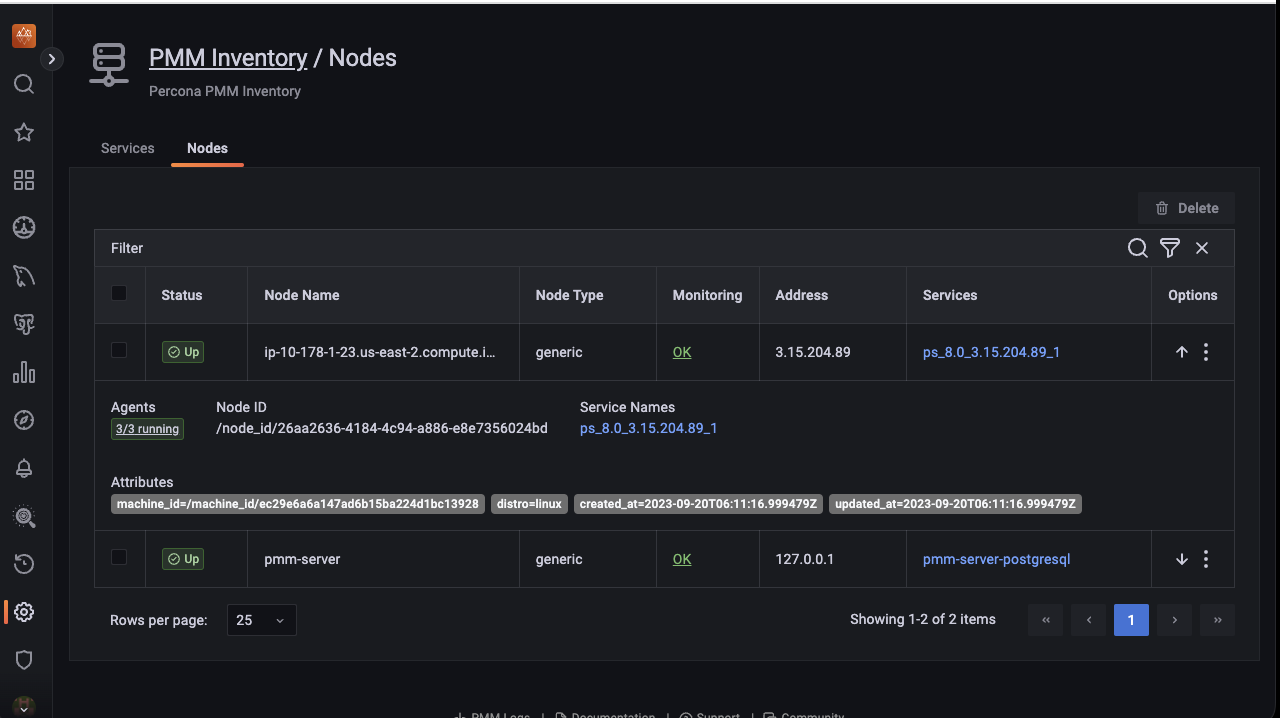
In our continuing endeavor to enhance user experience, we further improved the Inventory page by improving the Nodes tab. With this change, you can get more context on your inventory objects, such as nodes, and more actionable information for exploring and resolving possible issues.
Here is the change as part of PMM 2.38.0:
-
Check the number of agents running on any particular node. When you click on any node, the UI navigates to the view of agents, which is filtered to display only agents related to that specific node.
To see the details of the agents running:
On the Nodes tab, under the Monitoring column, click OK or Failed, depending on the status of the node that you have selected. A page that provides the user with crucial information regarding the total number of agents deployed on that node is displayed.
-
View comprehensive information about each agent, including key attributes such as node type, IP address, and associated services. This gives you a complete overview of the nodes at a glance.
-
Check the health status of the agents to see if they are running or have failed.
Backup enhancements
Better folder management for enhanced PBM compatibility
We’ve added a new Folder field to the Create Backup pages. Use this to set a specific target directory within the selected local or S3-compatible location for the backup.
Organizing backups in folders makes grouping PBM backups for clusters easier, and it improves PMM-PBM (Percona Backup for MongoDB) integration workflows.
The Folder field is automatically populated with the value of the cluster label. You can change this default folder from PMM’s Advanced Settings, but make sure you understand how your custom folder will impact PBM integration workflows.
Sharded cluster MongoDB backup support
This release introduces support for working with backups for sharded clusters. PMM handles the backup process end-to-end, but restoring such artifacts is currently possible only via the CLI, using Percona Backup for MongoDB.
For information on restoring sharded backups, check the PBM documentation.
SQL comments support in QAN
⚠️ Important/Caution
This feature is still in Technical Preview and is subject to change. We recommend that early adopters use this feature for testing purposes only.
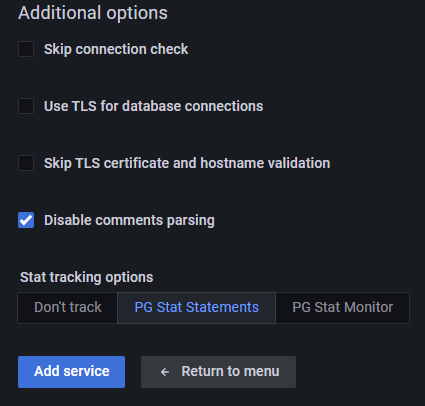
You can now collect labels from the comments placed in SQL queries. You can tag the query by key value in the query comment. This helps in query management and optimization. This feature is currently supported for MySQL and PostgreSQL.
For example:
SELECT * /* cluster=’east’ */ FROM city; You can enable this feature as follows:
-
CLI - Pass the parameter
comments-parsing -
UI - It is enabled by default. To disable, uncheck the Disable comments parsing checkbox in the Additional Options section. This is supported for PostgreSQL and MySQL.
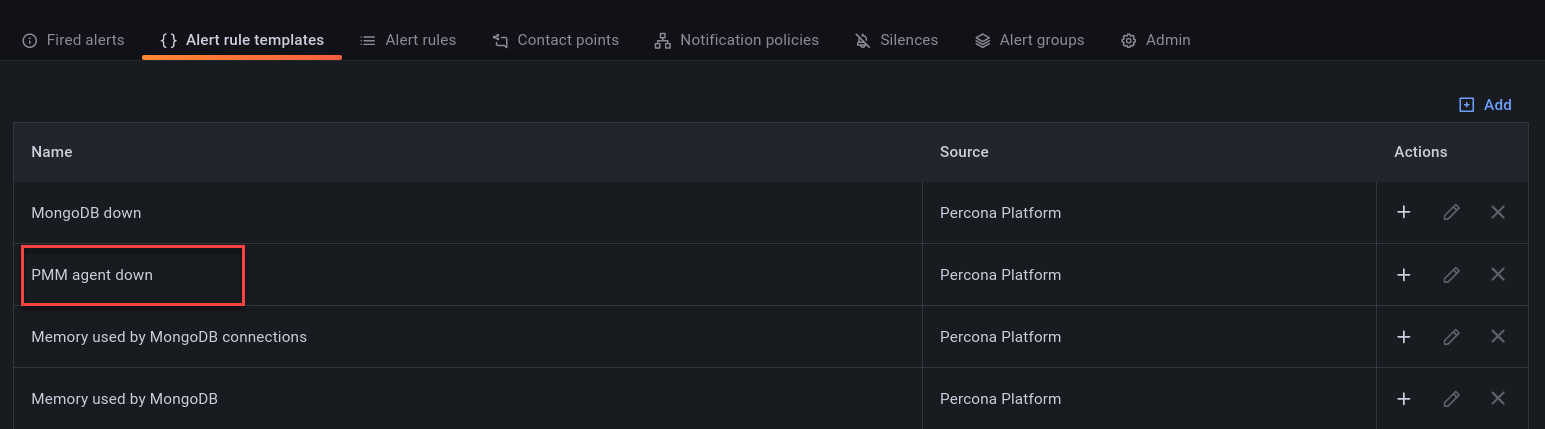
New PMM Agent Down alert template
We've added a new default alert template to Percona Alerting.
The new PMM Agent down alert template monitors your Node status to notify if the Agent is down. Before using this template:
- ensure the PMM Agent is healthy and present on the Database Node.
- check that PMM Client is on version 2.38 version or later.
Grafana upgrade
PMM now uses Grafana v9.2.20, which includes fixes for some critical vulnerabilities. For more information, see Grafana's release blog.
New Features
- PMM-2852 - [QAN]: Starting with PMM 2.38.0, MySQL and PostgreSQL supports collection of labels from the comments placed in the SQL queries.
- PMM-11961 - [Inventory]: Starting with PMM 2.38.0, we have enhanced the Inventory page by improving the Nodes tab. With this change, you can get more context on your inventory objects, such as node, and more actionable information for exploring and resolving possible issues.
- PMM-11962 - ...
v2.37.1
Percona Monitoring and Management 2.37.1
| Release date: | Jun 5, 2023 |
|---|---|
| Installation: | Installing Percona Monitoring and Management |
Percona Monitoring and Management (PMM) is an open source database monitoring, management, and observability solution for MySQL, PostgreSQL, and MongoDB.
⚠️ Important
We recommend using the latest version of PMM. This ensures that you have access to the latest PMM features and that your environment runs on the latest version of the underlying components, such as VictoriaMetrics, with all the bug fixes in place.
Release Highlights
We have identified and fixed CVE-2023-34409 in PMM 2.37.1:
PMM-12182: PMM authentication bypass vulnerability
Workaround
If you are unable to update PMM you can resolve this issue as follows:
-
Make changes to the NGINX configuration on the running PMM instance. To do so, create a Bash script with the code from this script on GitHub.
-
Apply the code using this
dockercommand on a server running the PMM Docker container (as root or using sudo):docker exec -it pmm-server bash -c 'curl -fsSL https://raw.githubusercontent.com/percona/pmm/main/scripts/authfix.sh | /bin/bash '
-
If you are running PMM via a virtual appliance (OVF or AMI), use SSH to shell into the PMM server and run this command:
curl -fsSL https://raw.githubusercontent.com/percona/pmm/main/scripts/authfix.sh | /bin/bash
For more details see, blogpost.