With this library you can create and run simple or complex hierarchies of perceptual control systems as well as make use of the power of the Python platform and its rich set of packages.
In the context of this library a single control system comprising a perceptual, reference, comparator and output function is called a Node. The functions therein can be configured by the user.
A hierarchy is defined by a collection of nodes.
pip install pct
Examples of importing the library functionality.
import pct as p
from pct.hierarchy import Hierarchy
from pct import *
Import modules from the PCT library.
from pct.nodes import PCTNodeFor the purposes of this example define a world model. This would not be required if the real world is used, or a simulation such as OpenAI Gym.
def velocity_model(velocity,  force , mass):
    velocity = velocity + force / mass
    return velocity

# World value
mass = 50
Create a PCTNode, a control system unit comprising a reference, perception, comparator and output function. The default value for the reference is 1. With the history flag set, the data for each iteration is recorded for later plotting.
pctnode = PCTNode(history=True)Call the node repeatedly to control the perception of velocity. With the verbose flag set, the control values are printed. In this case the printed values are the iteration number, the (velocity) reference, the perception, the error and the (force) output.
for i in range(40):
    print(i, end=" ")
    force = pctnode(verbose=True)
    velocity = velocity_model(pctnode.get_perception_value(), force, mass)
    pctnode.set_perception_value(velocity)
0 0.000 0.000 0.000 0.000
1 0.000 0.000 0.000 0.000
2 0.000 0.000 0.000 0.000
3 0.000 0.000 0.000 0.000
4 0.000 0.000 0.000 0.000
5 0.000 0.000 0.000 0.000
6 0.000 0.000 0.000 0.000
7 0.000 0.000 0.000 0.000
8 0.000 0.000 0.000 0.000
9 0.000 0.000 0.000 0.000
10 0.000 0.000 0.000 0.000
11 0.000 0.000 0.000 0.000
12 0.000 0.000 0.000 0.000
13 0.000 0.000 0.000 0.000
14 0.000 0.000 0.000 0.000
15 0.000 0.000 0.000 0.000
16 0.000 0.000 0.000 0.000
17 0.000 0.000 0.000 0.000
18 0.000 0.000 0.000 0.000
19 0.000 0.000 0.000 0.000
20 0.000 0.000 0.000 0.000
21 0.000 0.000 0.000 0.000
22 0.000 0.000 0.000 0.000
23 0.000 0.000 0.000 0.000
24 0.000 0.000 0.000 0.000
25 0.000 0.000 0.000 0.000
26 0.000 0.000 0.000 0.000
27 0.000 0.000 0.000 0.000
28 0.000 0.000 0.000 0.000
29 0.000 0.000 0.000 0.000
30 0.000 0.000 0.000 0.000
31 0.000 0.000 0.000 0.000
32 0.000 0.000 0.000 0.000
33 0.000 0.000 0.000 0.000
34 0.000 0.000 0.000 0.000
35 0.000 0.000 0.000 0.000
36 0.000 0.000 0.000 0.000
37 0.000 0.000 0.000 0.000
38 0.000 0.000 0.000 0.000
39 0.000 0.000 0.000 0.000
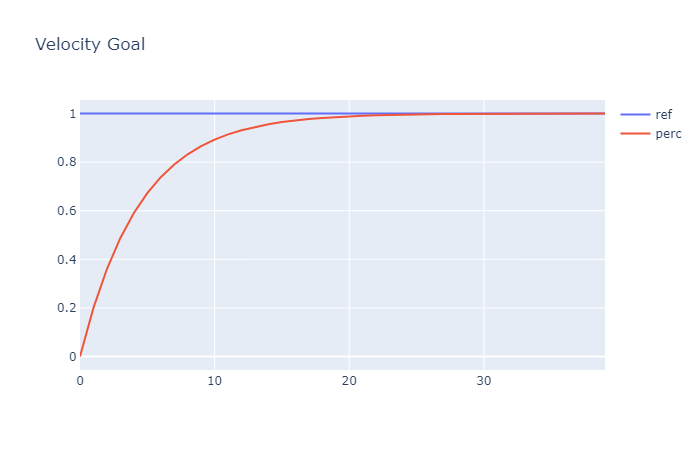
Using the plotly library plot the data. The graph shows the perception being controlled to match the reference value.
import plotly.graph_objects as go
fig = go.Figure(layout_title_text="Velocity Goal")
fig.add_trace(go.Scatter(y=pctnode.history.data['refcoll']['constant'], name="ref"))
fig.add_trace(go.Scatter(y=pctnode.history.data['percoll']['variable'], name="perc"))
This following code is only for the purposes of displaying image of the graph generated by the above code.
from IPython.display import ImageImage(url='http://www.perceptualrobots.com/wp-content/uploads/2020/08/pct_node_plot.png')This shows a very basic example of the use of the PCT library. For more advanced functionality see the API documentation at https://perceptualrobots.github.io/pct/.
