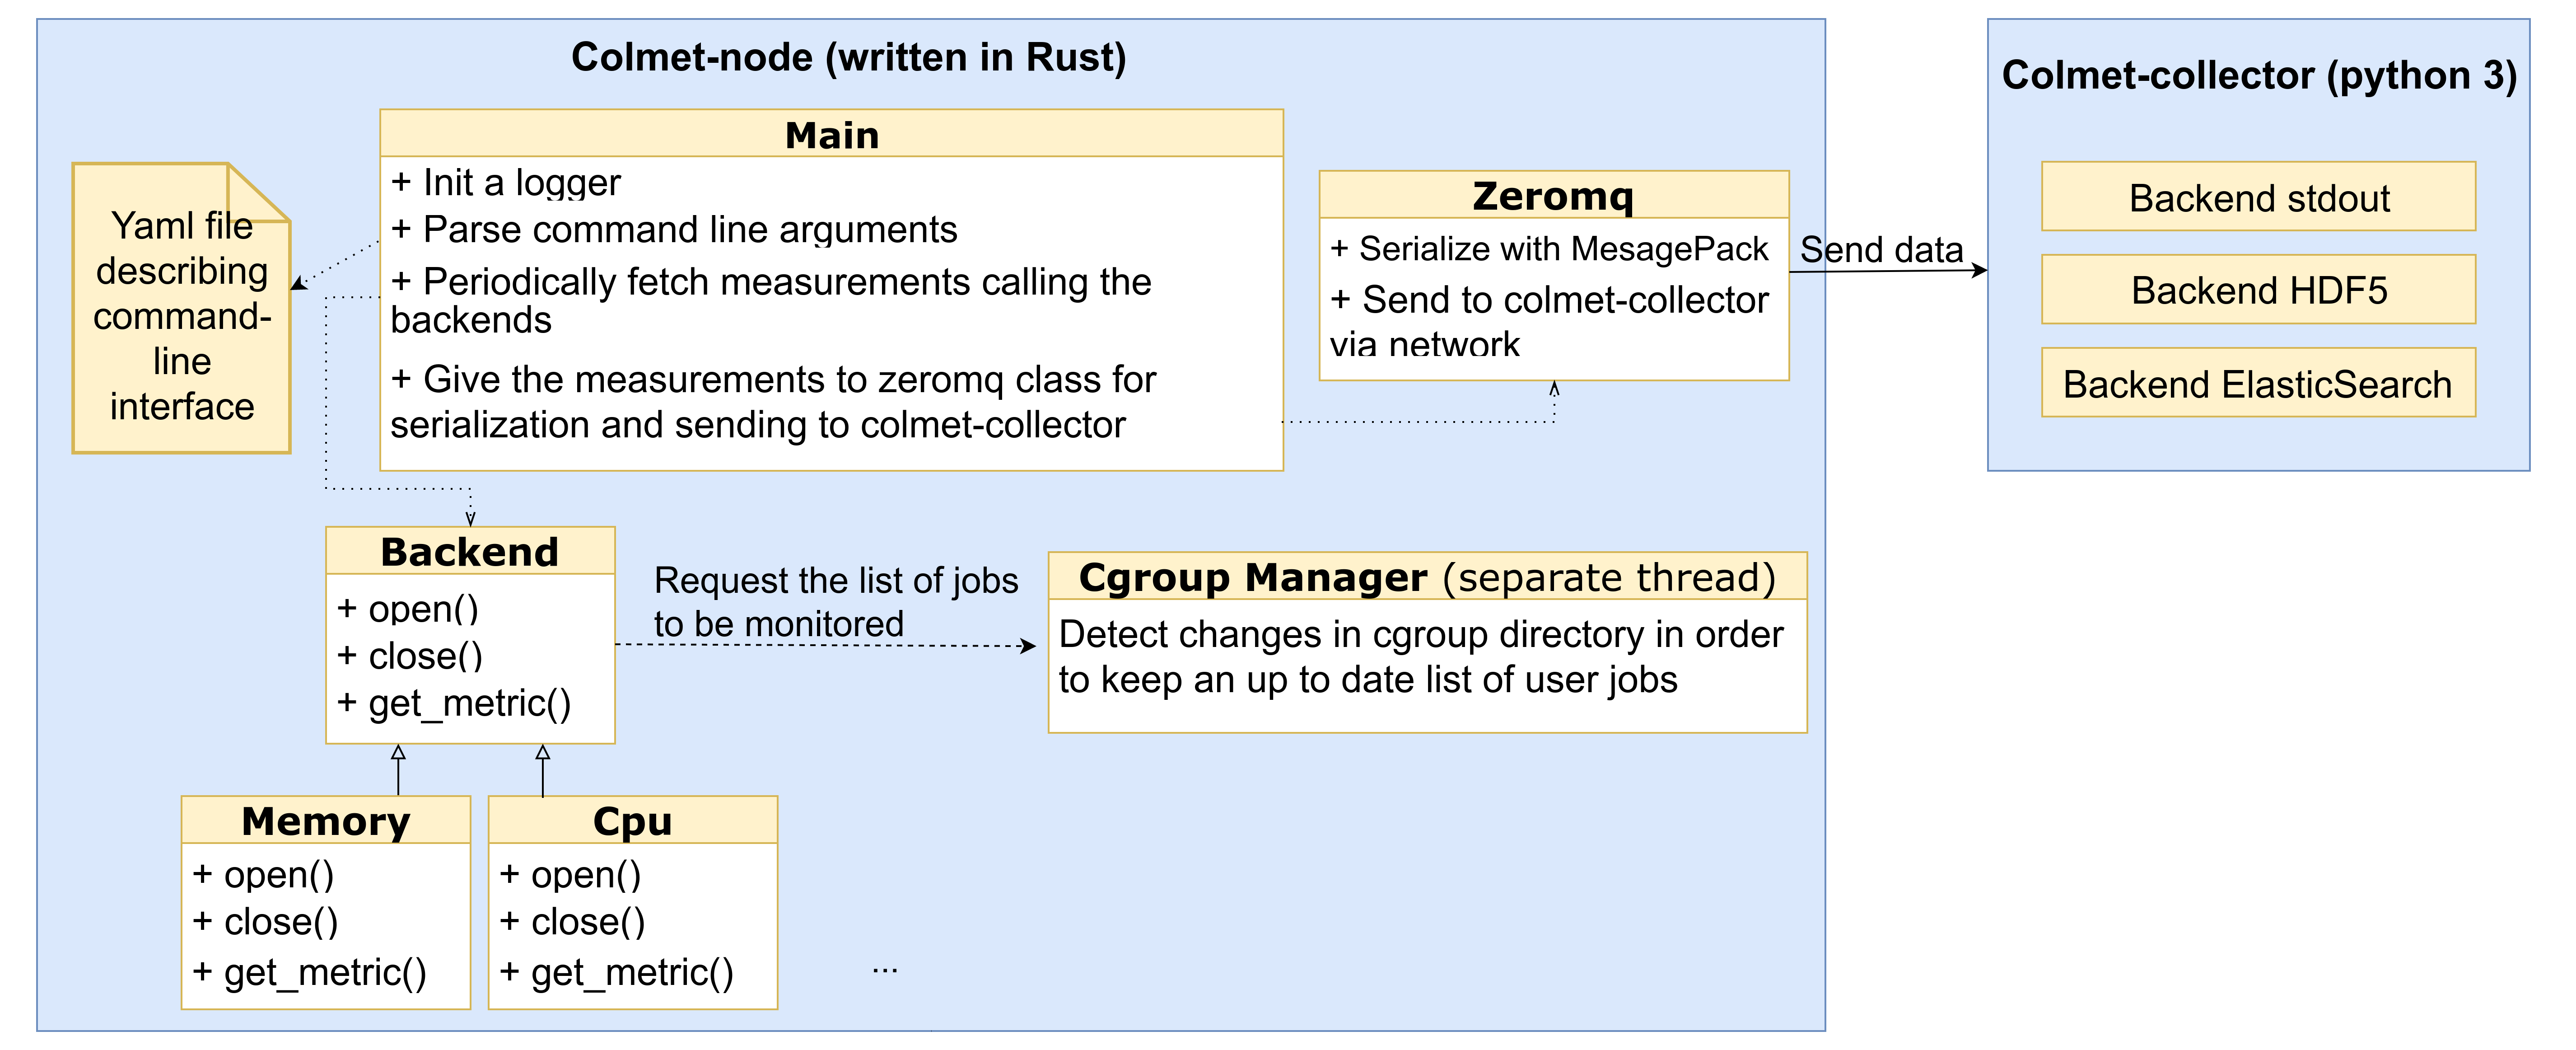
Start of a rewrite of colmet-node in rust.
- Start a job
oarsub -I
- Install Rust
sudo-g5k
curl https://sh.rustup.rs -sSf | sh
source $HOME/.cargo/env
- Clone Colmet repository and cd into it
git clone --single-branch --branch colmet-rust https://github.com/oar-team/colmet.git
cd Colmet
- Install ZeroMQ
sudo apt-get install libzmq3-dev
- Install MsgPack (for collector)
pip3 install msgpack
- Initialize perfevent cgroup
sudo ln -s /sys/fs/cgroup/perf_event /dev/oar_cgroups_links/

sudo mkdir -p /dev/oar_cgroups_links/perf_event$OAR_CPUSET

echo $$ | sudo tee -a /dev/oar_cgroups_links/perf_event$OAR_CPUSET/tasks
- Start Colmet-collector (in another terminal in the same job)
python3 ./collector/main.py
- You can change Colmet sample period and metrics collected by perfhw without restarting Colmet-node by sending 0mq message with this python script:
python3 configure_colmet.py 1.5 "cache_ll,emulation_faults"
colmet-collector : hdf5 backend, make code error-resistant regardeless the data received from colmet-node
colmet-node : several backends, handle errors (especially when backends can't access underlying monitoring tools, librairies, etc), reset metrics collected by perfhwbakend at the end of the job, and also make more tests
This provides metrics collected using interface perf_event_open.
Usage : start colmet-node with option --enable-perfhw
Optionnaly choose the metrics you want (max 5 metrics) using options --perfhw-list followed by space-separated list of the metrics/
Example : --enable-perfhw --perfhw-list instructions cpu_cycles cache_misses
A file named perfhw_mapping.[timestamp].csv is created in the working directory. It establishes the correspondence between counter_1, counter_2, etc from hdf5 files and the actual name of the metric.
Available metrics (refers to perf_event_open documentation for signification) :
cpu_cycles
instructions
cache_references
cache_misses
branch_instructions
branch_misses
bus_cycles
ref_cpu_cycles
cache_l1d
cache_ll
cache_dtlb
cache_itlb
cache_bpu
cache_node
cache_op_read
cache_op_prefetch
cache_result_access
cpu_clock
task_clock
page_faults
context_switches
cpu_migrations
page_faults_min
page_faults_maj
alignment_faults
emulation_faults
dummy
bpf_output
RAPL is a feature on recent Intel processors that makes possible to know the power consumption of cpu in realtime.
Usage : start colmet-node with option --enable-RAPL
A file named RAPL_mapping.[timestamp].csv is created in the working directory. It established the correspondence between counter_1, counter_2, etc from hdf5 files and the actual name of the metric as well as the package and zone (core / uncore / dram) of the processor the metric refers to.
If a given counter is not supported by harware the metric name will be "counter_not_supported_by_hardware" and 0 values will appear in hdf5 table; -1 values in hdf5 table means there is no counter mapped to the column.
This backend gets temperatures from /sys/class/thermal/thermal_zone*/temp
Usage : start colmet-node with option --enable-temperature
A file named temperature_mapping.[timestamp].csv is created in the working directory. It establishes the correspondence between counter_1, counter_2, etc from hdf5 files and the actual name of the metric.
colmet-collector : hdf5 backend, make code error-resistant regardeless the data received from colmet-node
colmet-node : several backends, handle errors (especially when backends can't access underlying monitoring tools, librairies, etc), reset metrics collected by perfhwbakend at the end of the job, and also make more tests.
