DROMA-DB is a comprehensive database and analysis tool that integrates the largest published studies investigating cancer response to chemical compounds and the associations between drug sensitivity and multi-omics data (mRNA, CNV, protein, mutation, etc.) across various cancer models including PDC (Patient-Derived Cells), PDO (Patient-Derived Organoids), and PDX, human data are under development.

deng1-3 are our in house pdo data, others are all pcd data.

If you use DROMA-DB in your research, please cite:
Li, S., Peng, Y., Chen, M. et al. Facilitating integrative and personalized oncology omics analysis with UCSCXenaShiny. Commun Biol 7, 1200 (2024). https://doi.org/10.1038/s42003-024-06891-2
DROMA-DB offers a range of powerful features for cancer pharmacogenomics research:
-
Comprehensive Data Integration: Includes high-throughput cancer type PDO, PDC, PDX data associated between drug sensitivity and multi-omics, as well as in-house data.
-
Drug-Omics Pairs Analysis: Explore associations between specific drug responses and omics features with statistical rigor.
-
Batch Features Associations Analysis: Conduct large-scale analysis of associations between a target feature and all features in a dataset.
-
Filtering Capabilities: Filter analyses by data type (cell lines or PDO) and tumor type for more targeted research.
-
Statistical Visualization: View meta-analysis forest plots, volcano plots, and other visualizations to understand relationships.
-
Data Export: Download results in various formats (PDF, CSV, R objects) for further analysis.
This section provides overview statistics about the database:
- Drug and sample counts by source
- Data type counts (cell lines vs PDO)
- Molecular characteristics available in each dataset
- Drug and sample overlap between datasets
- Tumor type distribution

A. Drug and sample distribution within the dataset. A total of 2,065 drugs and 1,815 samples are represented in the dataset, with cell lines (2,065 drugs) being more extensively tested than patient-derived organoids (PDO, 78 drugs tested). For type of resource, PRISM shows the highest number of drugs, while GDSC2 contains the most cell lines. B. Molecular characterization coverage across dataset types. Multiple omics data types, such as whole-exome sequencing, RNA-Seq, and proteomics, are available for different systems, with variation observed across DEG and PDO datasets. Gene fusion data are limited to specific subsets. C. Mechanisms of action (MOA) for drugs tested in the dataset. The dataset comprises diverse drug classes, encompassing EGFR inhibitors (69 drugs), VEGFR inhibitors (70 drugs), PI3K inhibitors (51 drugs), and CDK inhibitors (24 drugs), among others. Targeted therapies dominate the collection. D. Tumor type distribution across organ systems. Tumor systems represented include lung (1373), blood/lymphatic (1028 samples), gastrointestinal (669 samples), breast (513 samples), and other tumors. The sizes of the bubbles correlate with the number of samples per tumor system.
Web application can only be accessed in UM campus: http://fscpo.fhs.um.edu.mo/DROMA_DB/
install the relative packages:
install.packages("pacman")
pacman::p_load(
  shiny,         # Shiny application framework
  shinyWidgets,  # Shiny widgets
  shinyjs,       # JavaScript functionalities for Shiny
  waiter,        # Loading screens and waiters
  DT,            # Data tables for Shiny
  dplyr,         # Data manipulation
  data.table,    # Fast data processing
  meta,          # Meta-analysis
  metafor,       # Meta-analysis with advanced methods
  effsize,       # Effect size calculations
  UpSetR,        # Visualizing set intersections
  ggpubr,        # Publication-ready plots
  plotly,        # Interactive plots
  grid, gridExtra, # plots
  ggrepel,       # label top features
  treemapify,    # tree plot
  patchwork,     # Arranging and combining plots
  snowfall,      # Parallel computing with snow
  parallel       # Parallel computation
)
download the input data to Input/: Input data for DROMA_DB
-
Clone the repository:
git clone https://github.com/yourusername/DROMA-DB.git -
Open the project in RStudio by clicking on the
Project.Rprojfile. -
Run the application:
source("App.R")
ref: How to Deploy Interactive R Apps with Shiny Server | Linode Docs
sudo apt-get install r-base

sudo R -e "install.packages('shiny', repos = 'https://mirror.tuna.tsinghua.edu.cn/CRAN/')"
shiny must be in system library.
put shiny server content under /srv/shiny-server/, I use soft link:
$ ls  -lh /srv/shiny-server/
total 0
lrwxrwxrwx 1 shiny shiny 21 Jan 21 14:54 DROMA_DB -> /home/shiny/DROMA_DB/
lrwxrwxrwx 1 root  root  38 Apr  3  2024 index.html -> /opt/shiny-server/samples/welcome.html
lrwxrwxrwx 1 shiny shiny 23 Apr  9  2024 OmicsPharDB -> /home/shiny/OmicsPharDB
lrwxrwxrwx 1 root  root  37 Apr  3  2024 sample-apps -> /opt/shiny-server/samples/sample-apps
# bash Miniconda3-latest-Linux-x86_64.sh

# mamba install -y r-base
sudo apt-get install gdebi-core
wget https://download3.rstudio.org/ubuntu-18.04/x86_64/shiny-server-1.5.21.1012-amd64.deb

sudo gdebi shiny-server-1.5.21.1012-amd64.deb
install shiny:
sudo su - -c "R -e \"install.packages('bslib')\""
sudo su - -c "R -e \"install.packages('sass')\""
sudo su - -c "R -e \"install.packages('shiny')\""

# sudo R -e "install.packages('shiny', repos = 'https://mirror.tuna.tsinghua.edu.cn/CRAN/')"
less /etc/shiny-server/shiny-server.conf
# shiny-server.conf
deploy on target ports, I change it from default 3838 to 8888:
$ cat /etc/shiny-server/shiny-server.conf
# Instruct Shiny Server to run applications as the user "shiny"
run_as shiny;

# Define a server that listens on port 8888
server {
  listen 8888;

  # Define a location at the base URL
  location / {

    # Host the directory of Shiny Apps stored in this directory
    site_dir /srv/shiny-server;

    # Log all Shiny output to files in this directory
    log_dir /var/log/shiny-server;

    # When a user visits the base URL rather than a particular application,
    # an index of the applications available in this directory will be shown.
    directory_index on;
  }
}
log:
cat /var/log/shiny-server/
also need to install these packages:
install.packages("pacman")
pacman::p_load(
  shiny,         # Shiny application framework
  shinyWidgets,  # Shiny widgets
  shinyjs,       # JavaScript functionalities for Shiny
  waiter,        # Loading screens and waiters
  DT,            # Data tables for Shiny
  dplyr,         # Data manipulation
  data.table,    # Fast data processing
  meta,          # Meta-analysis
  metafor,       # Meta-analysis with advanced methods
  effsize,       # Effect size calculations
  UpSetR,        # Visualizing set intersections
  ggpubr,        # Publication-ready plots
  plotly,        # Interactive plots
  grid, gridExtra, # plots
  ggrepel,       # label top features
  treemapify,    # tree plot
  patchwork,     # Arranging and combining plots
  snowfall,      # Parallel computing with snow
  parallel       # Parallel computation
)
start shiny:
sudo systemctl start shiny-server
sudo systemctl stop shiny-server
sudo systemctl restart shiny-server
# or
service shiny-server status
service shiny-server restart
service shiny-server stop
DROMA-DB consists of two main sections:
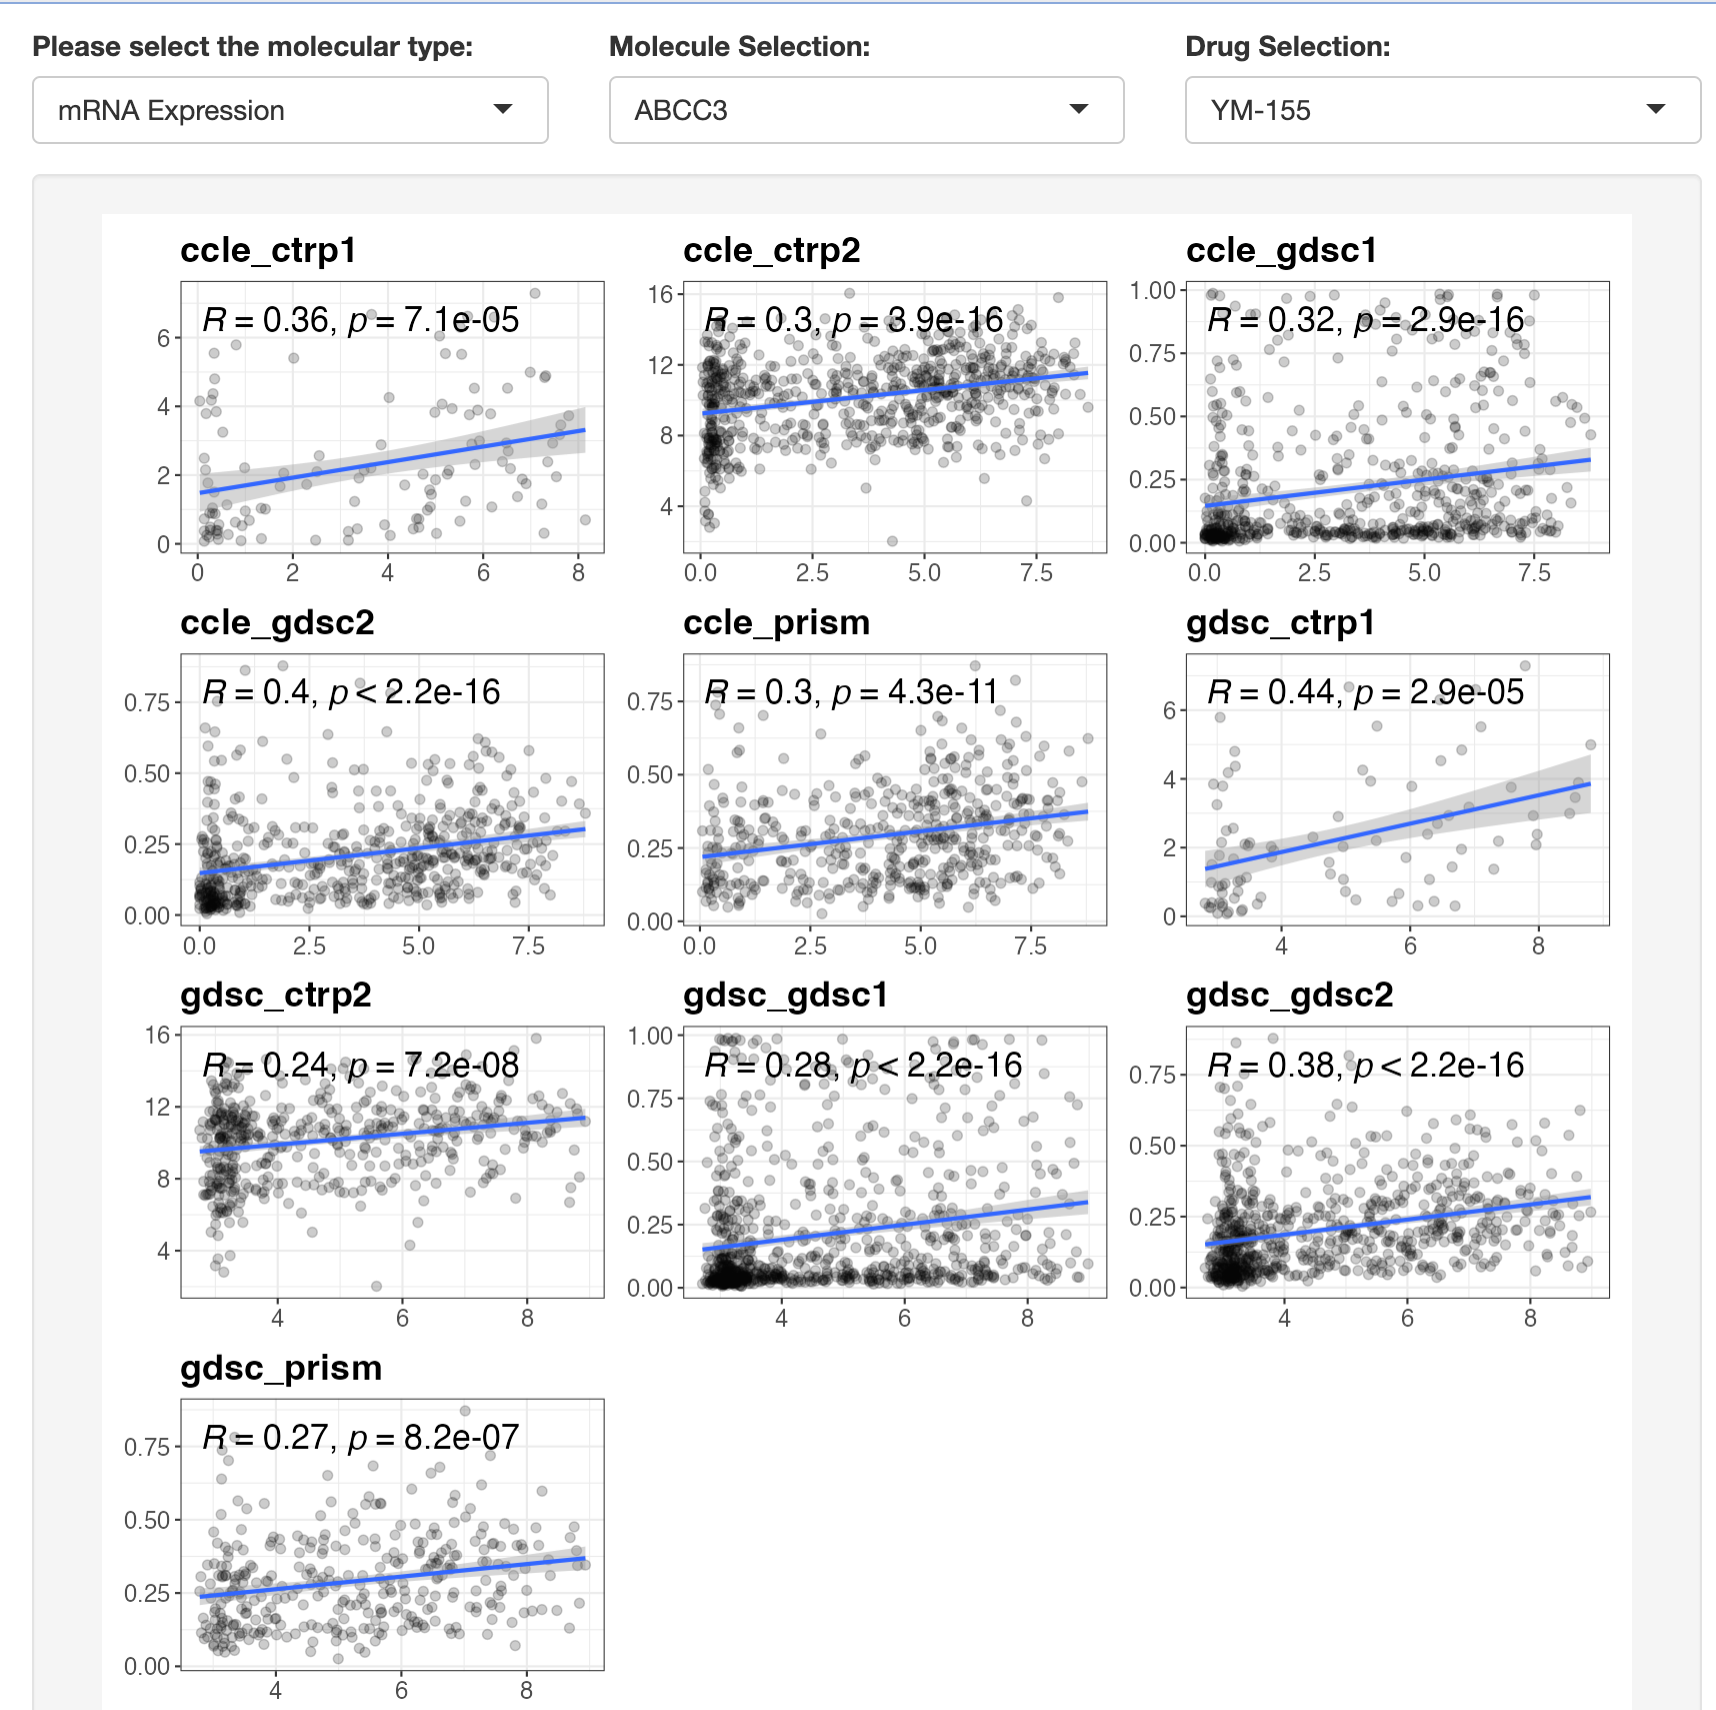
This module allows you to explore the association between a selected drug resistance event and a specific omic feature:
- Select a molecular type (mRNA, CNV, mutation, etc.)
- Choose a specific molecular feature
- Select a drug of interest
- Filter by data type (cell lines or PDO) and tumor type
- View statistical results and visualizations
For continuous omics data (mRNA, methylation, CNV, protein), Spearman correlation is calculated. For discrete omics data (mutations, fusions), Wilcoxon tests are used.
This module helps you conduct significant tests between a targeted feature (a drug or an omic) and all features in a particular dataset:
- Select a feature type and specific feature
- Choose a second feature type to compare against
- Filter by data type and tumor type
- View results as a volcano plot
- Download results for further analysis
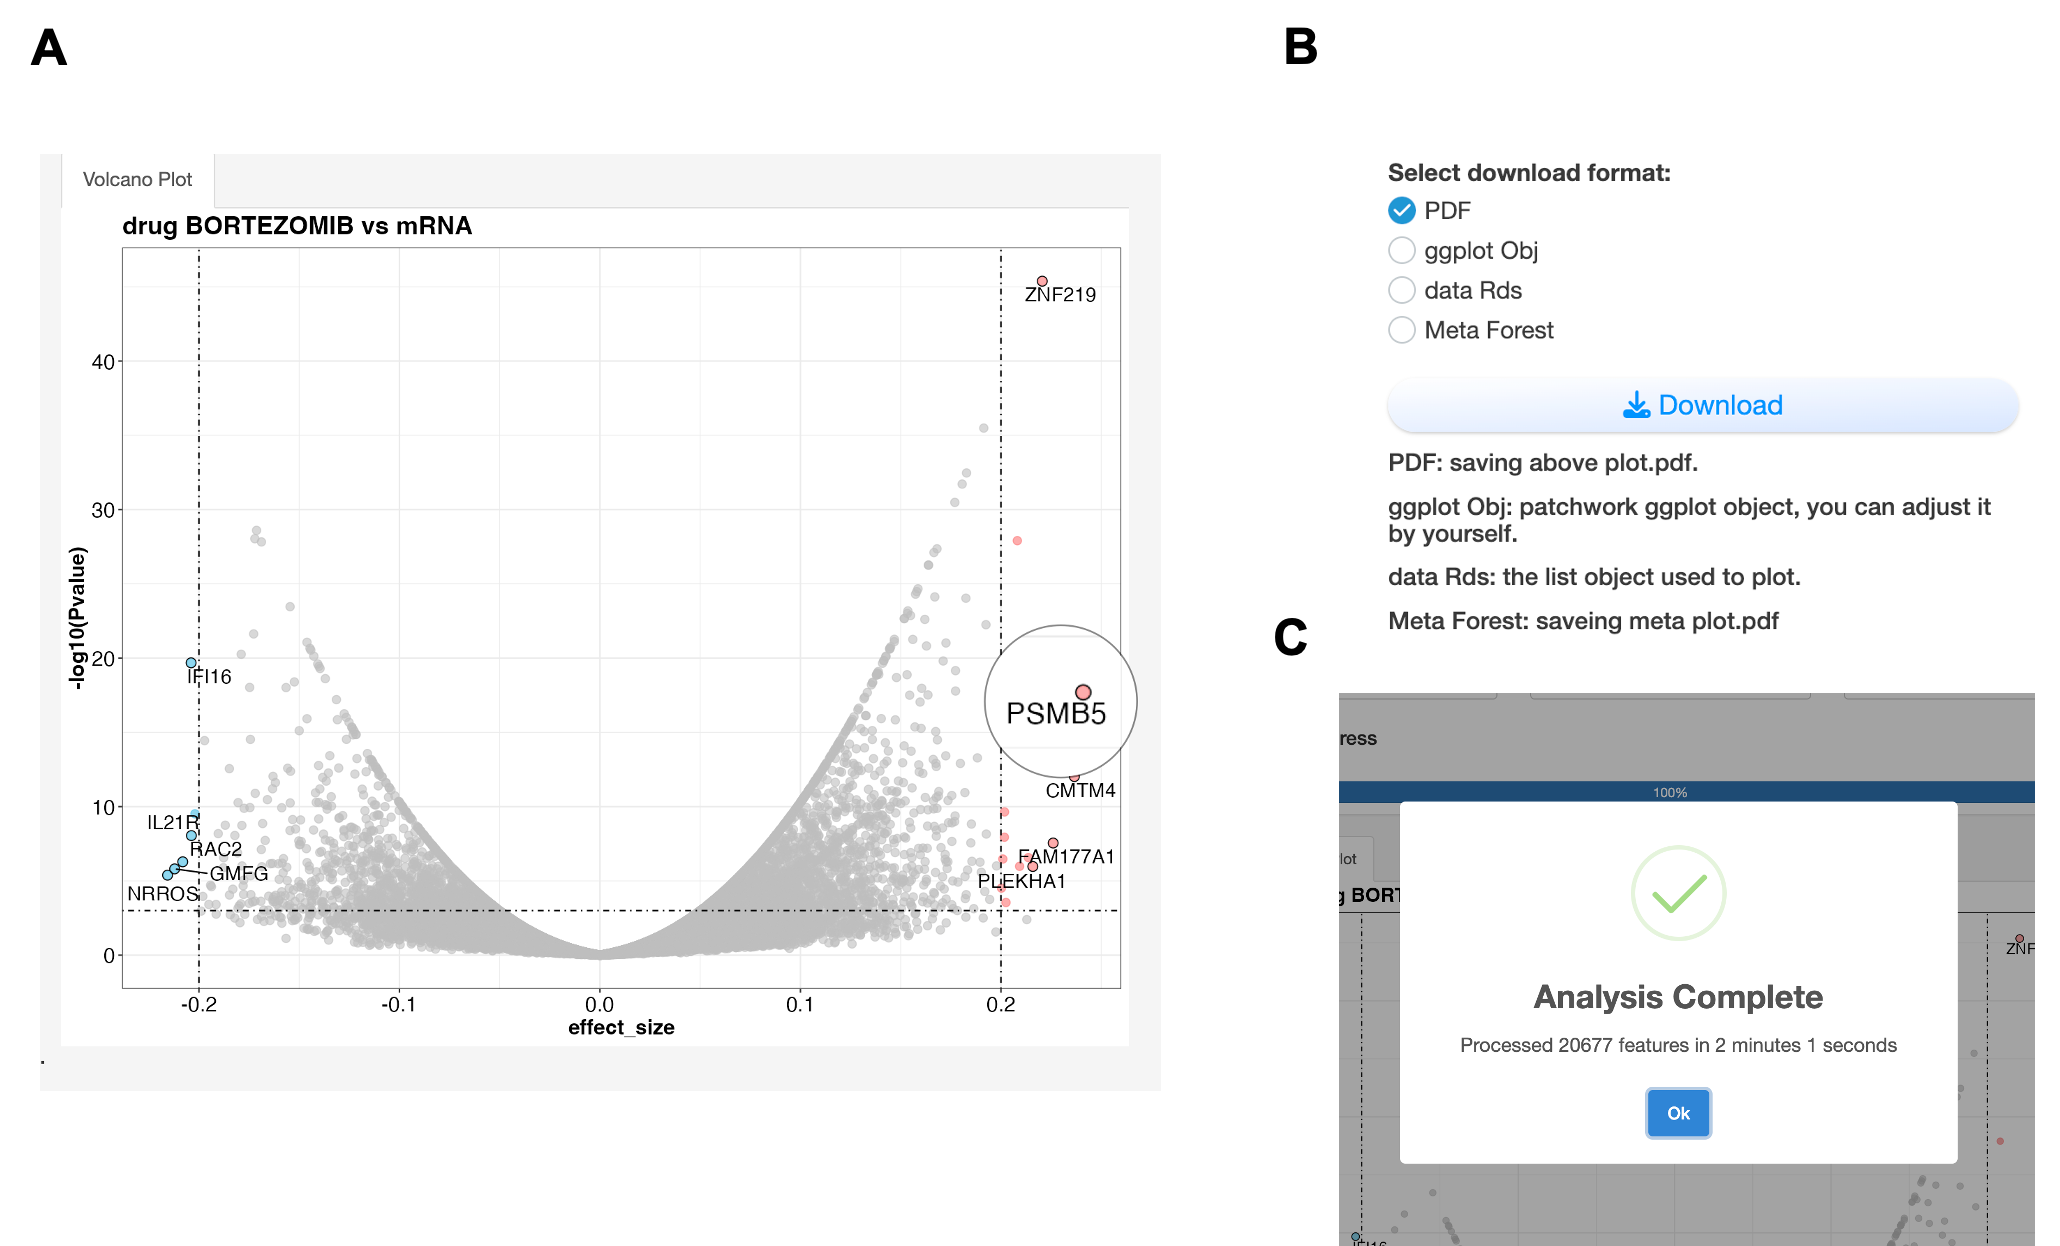
A. Volcano plot showing associations between Bortezomib and mRNA expression. The x-axis represents effect size (strength and direction of association), while the y-axis shows statistical significance (-log10 p-value). Red points indicate significant positive associations (effect size > 0.2, p < 0.001), suggesting resistance markers; blue points show significant negative associations, suggesting sensitivity markers. The effect size is calculated from meta analysis which each feature pairs use different statistic method depends on data type: 1) For continuous vs. continuous features (e.g., drug vs. mRNA): Pearson correlation; 2) For discrete vs. continuous features (e.g., mutation vs. drug), Wilcoxon test; 3) For discrete vs. discrete features (e.g., mutation vs. fusion): Chi-squared test. PSMB5 may server as a potential Bortezomib resistance gene from screen. B. All results are downloadable in various formats (PDF, CSV, R objects) for further analysis. C. A popup window can remind user the completion of analysis.
On the left of screen there is a floating widget:
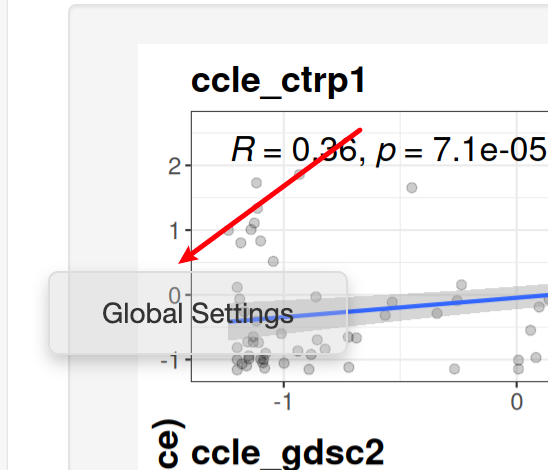
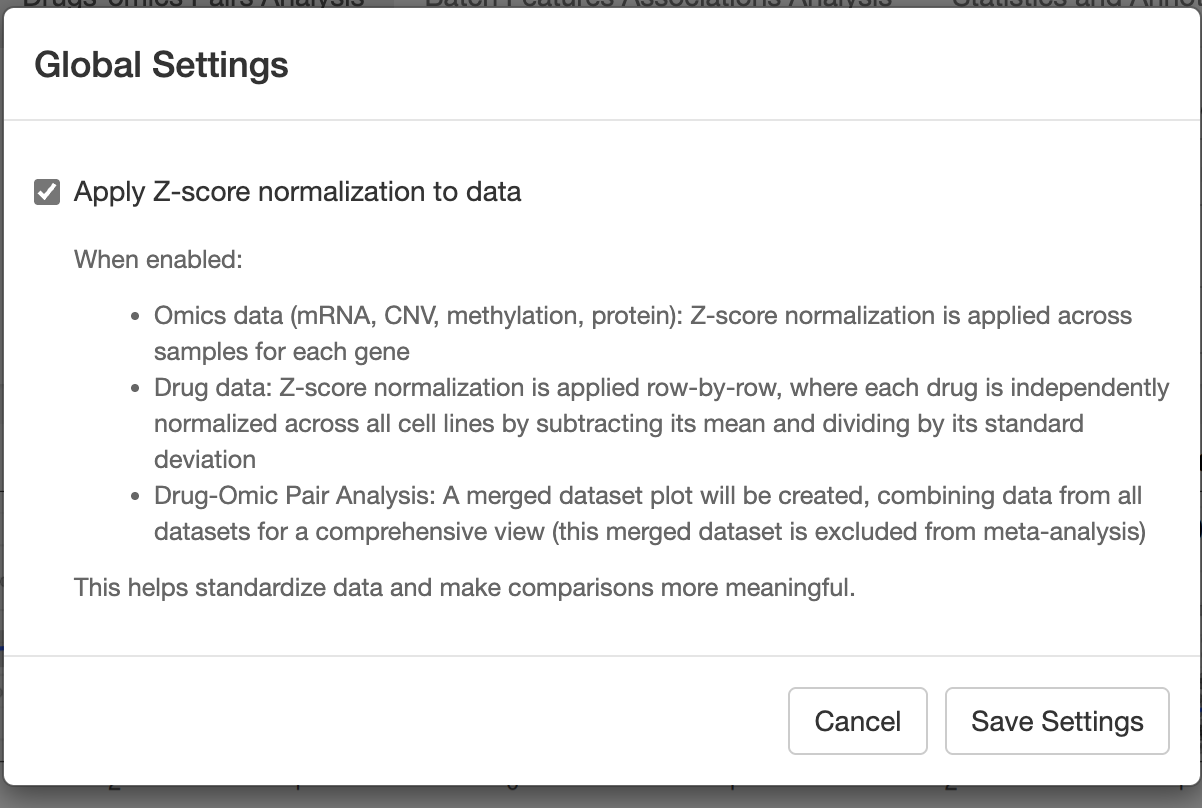
After clicking it, you could do some global settings:
- App.R: Main application file
- Modules/: Contains UI and server components for different application sections
- DrugOmicPair.R: Drug-omics pairs analysis module
- BatchFeature.R: Batch features analysis module
- StatAnno.R: Statistics and annotations module
- LoadData.R: Data loading module
- Preprocess.R: Data preprocessing module
- Package_Function/: Contains core functionality
- FuncGetData.R: Data retrieval functions
- FuncDrugOmicPair.R: Drug-omics pair analysis functions
- FuncBatchFeature.R: Batch feature analysis functions
- Input/: Contains data files
- config.yml: Configuration settings
DROMA-DB integrates data from multiple sources:
- Cell Line Data: CCLE, GDSC, gCSI, CTRP1, CTRP2, PRISM
- Patient-Derived Organoid (PDO) Data: In-house and published datasets
- Annotation Data: Comprehensive annotations for samples and drugs
Feel free to contact us if you find any bugs or have any suggestions:
- Email: [email protected]
- GitHub: https://github.com/mugpeng
This project is licensed under the MIT License - see the LICENSE file for details.
I will attend UM PhD seminar, welcome!

The stable version v0.2 is online now in UM network: http://fscpo.fhs.um.edu.mo/DROMA_DB/ Btw, please be patient, it may take 10-20s when first time start it. :)
This update includes:
- Add denglab three PDO data(deng1(breast), deng2(colon), deng3(nasopharynx)) with paired RNAseq, IC50 and annotation data;
- Harmonize cell line drug and cell names also the annotation data;
- Add choice to filter data for a specific tumor type(Breast, lung..) or data type(cell line, PDO), and a global setting page to set data. Now all continous data is transformed to by z-score in default, which allow to add a merged result for visualization ;
- Add several figures and some visualization-related improvement.
gitingest -o gitingest_output/0314.txt -e rsconnect -e Input -e Output -e Log -e Test -e Others -e images -e readme.md -e .DS_Store -e .Rproj.user -e .Rhistory
<div class="row">
    <div class="column" style="float:left;width:75%">
     	   DROMA-DB is a comprehensive database and analysis tool that integrates the largest published studies investigating cancer response to chemical compounds and the associations between drug sensitivity and multi-omics data (mRNA, CNV, protein, mutation, etc.) across various cancer models including PDC (Patient-Derived Cells), PDO (Patient-Derived Organoids), and PDX, human data are under development.
    </div>
    <div class="column" style="float:left;width:25%">
        <img src="http://cos01.mugpeng.top/img/20250310150357.png">
    </div>
</div>