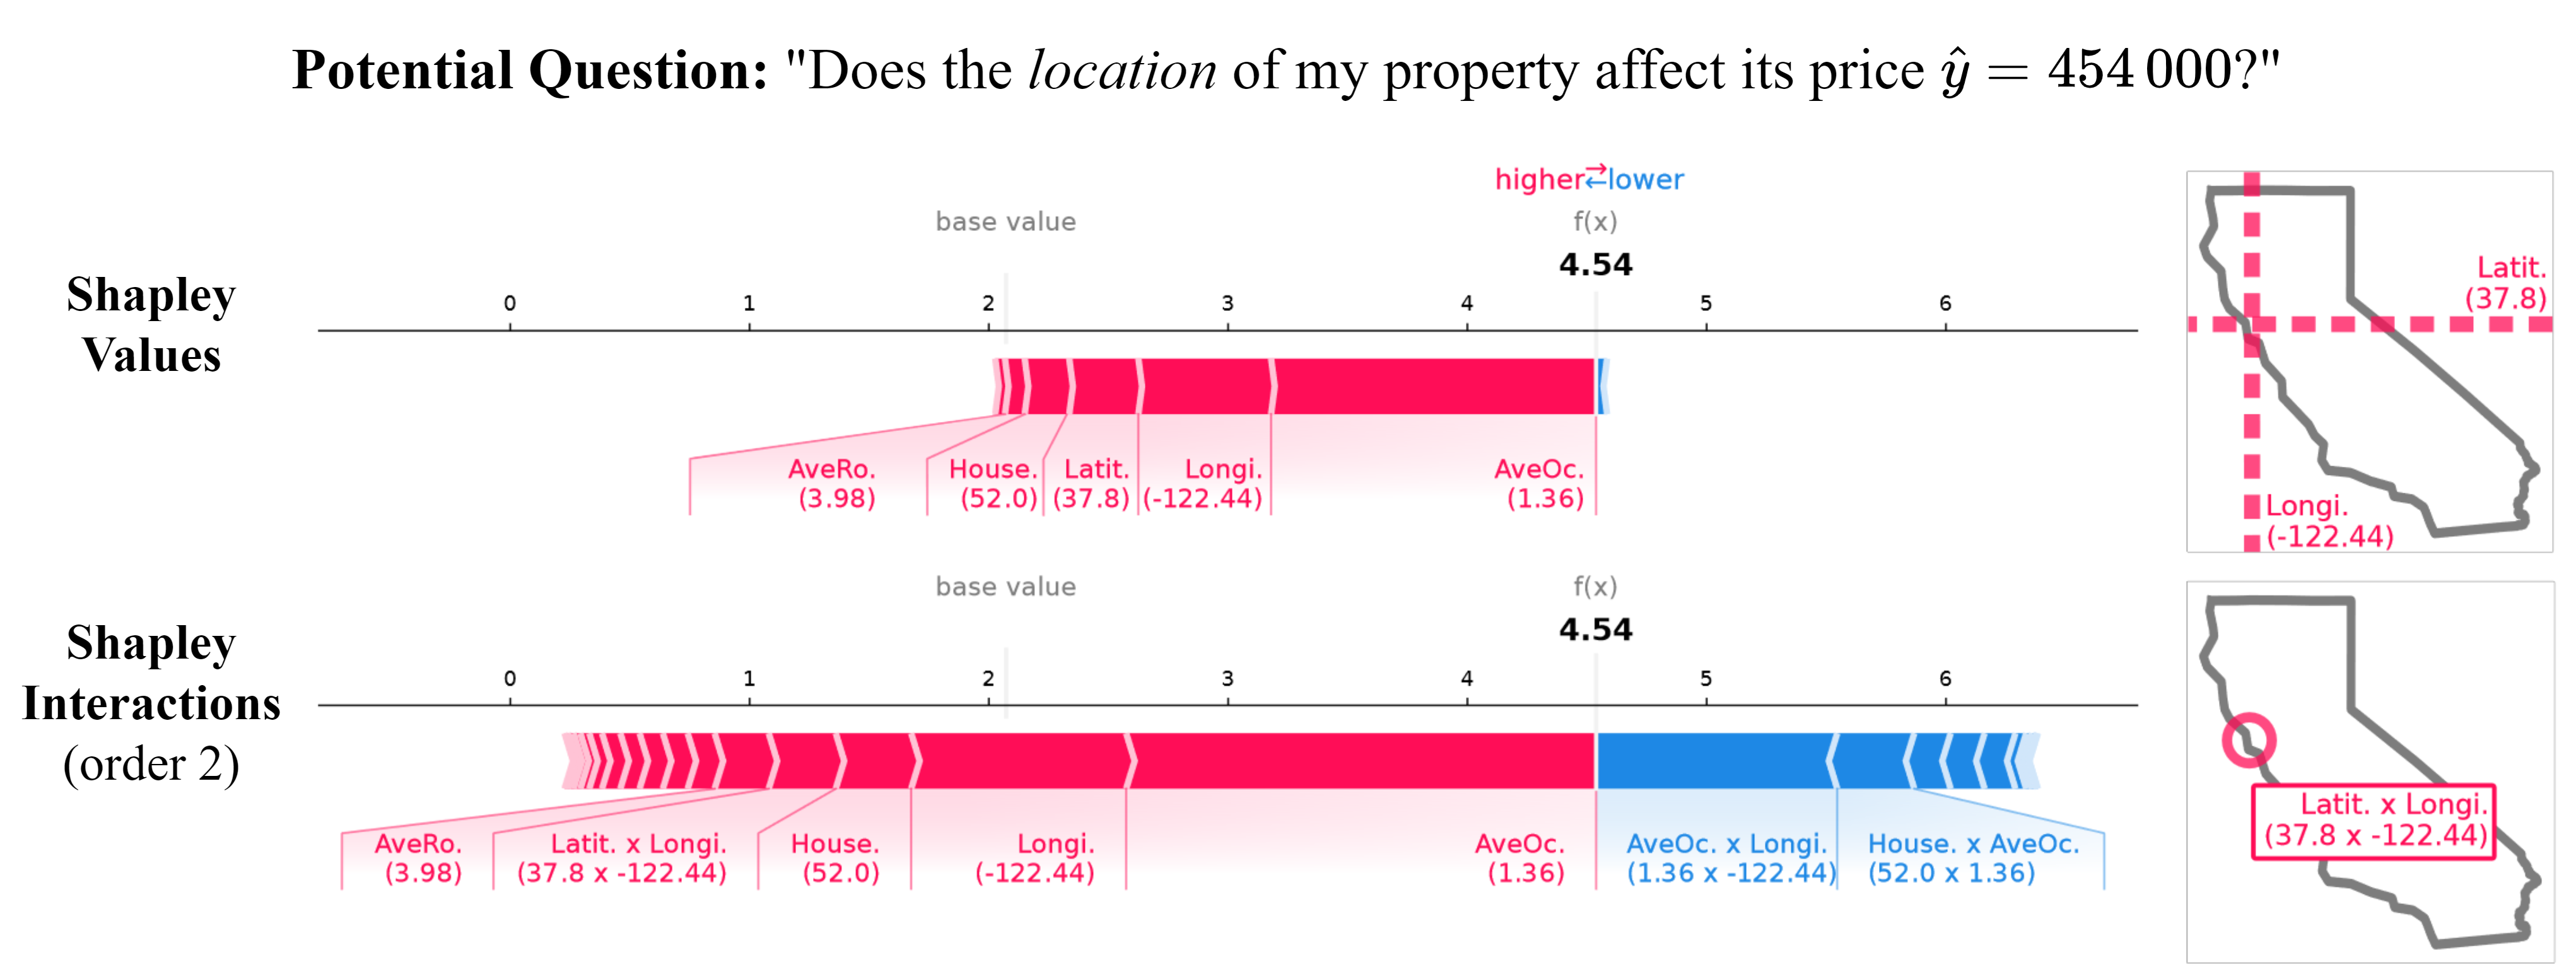
An interaction may speak more than a thousand main effects.
Shapley Interaction Quantification (shapiq) is a Python package for (1) approximating any-order Shapley interactions, (2) benchmarking game-theoretical algorithms for machine learning, (3) explaining feature interactions of model predictions. shapiq extends the well-known shap package for both researchers working on game theory in machine learning, as well as the end-users explaining models. SHAP-IQ extends individual Shapley values by quantifying the synergy effect between entities (aka players in the jargon of game theory) like explanatory features, data points, or weak learners in ensemble models. Synergies between players give a more comprehensive view of machine learning models.
shapiq is intended to work with Python 3.10 and above.
Installation can be done via uv :
uv add shapiqor via pip:
pip install shapiqSee what’s on the horizon for the library in our GitHub Project Board. We plan and track upcoming features, improvements, and maintenance tasks there including new explainers, performance optimizations, and expanded model support.
You can explain your model with shapiq.explainer and visualize Shapley interactions with shapiq.plot.
If you are interested in the underlying game theoretic algorithms, then check out the shapiq.approximator and shapiq.games modules.
Explain your models with Shapley interactions:
Just load your data and model, and then use a shapiq.Explainer to compute Shapley interactions.
import shapiq
# load data
X, y = shapiq.load_california_housing(to_numpy=True)
# train a model
from sklearn.ensemble import RandomForestRegressor
model = RandomForestRegressor()
model.fit(X, y)
# set up an explainer with k-SII interaction values up to order 4
explainer = shapiq.TabularExplainer(
    model=model,
    data=X,
    index="k-SII",
    max_order=4
)
# explain the model's prediction for the first sample
interaction_values = explainer.explain(X[0], budget=256)
# analyse interaction values
print(interaction_values)

>> InteractionValues(
>>     index=k-SII, max_order=4, min_order=0, estimated=False,
>>     estimation_budget=256, n_players=8, baseline_value=2.07282292,
>>     Top 10 interactions:
>>         (0,): 1.696969079  # attribution of feature 0
>>         (0, 5): 0.4847876
>>         (0, 1): 0.4494288  # interaction between features 0 & 1
>>         (0, 6): 0.4477677
>>         (1, 5): 0.3750034
>>         (4, 5): 0.3468325
>>         (0, 3, 6): -0.320  # interaction between features 0 & 3 & 6
>>         (2, 3, 6): -0.329
>>         (0, 1, 5): -0.363
>>         (6,): -0.56358890
>> )If you are used to working with SHAP, you can also compute Shapley values with shapiq the same way:
You can load your data and model, and then use the shapiq.Explainer to compute Shapley values.
If you set the index to 'SV', you will get the Shapley values as you know them from SHAP.
import shapiq

data, model = ...  # get your data and model
explainer = shapiq.Explainer(
    model=model,
    data=data,
    index="SV",  # Shapley values
)
shapley_values = explainer.explain(data[0])
shapley_values.plot_force(feature_names=...)
Once you have the Shapley values, you can easily compute Interaction values as well:
explainer = shapiq.Explainer(
    model=model,
    data=data,
    index="k-SII",  # k-SII interaction values
    max_order=2     # specify any order you want
)
interaction_values = explainer.explain(data[0])
interaction_values.plot_force(feature_names=...)For large-scale use-cases you can also check out the 👓ProxySPEX approximator.
# load your data and model with large number of features
data, model, n_features = ...

# use the ProxySPEX approximator directly
approximator = shapiq.ProxySPEX(n=n_features, index="FBII", max_order=2)
fbii_scores = approximator.approximate(budget=2000, game=model.predict)

# or use ProxySPEX with an explainer
explainer = shapiq.Explainer(
    model=model,
    data=data,
    index="FBII",
    max_order=2,
    approximator="proxyspex"  # specify ProxySPEX as approximator
)
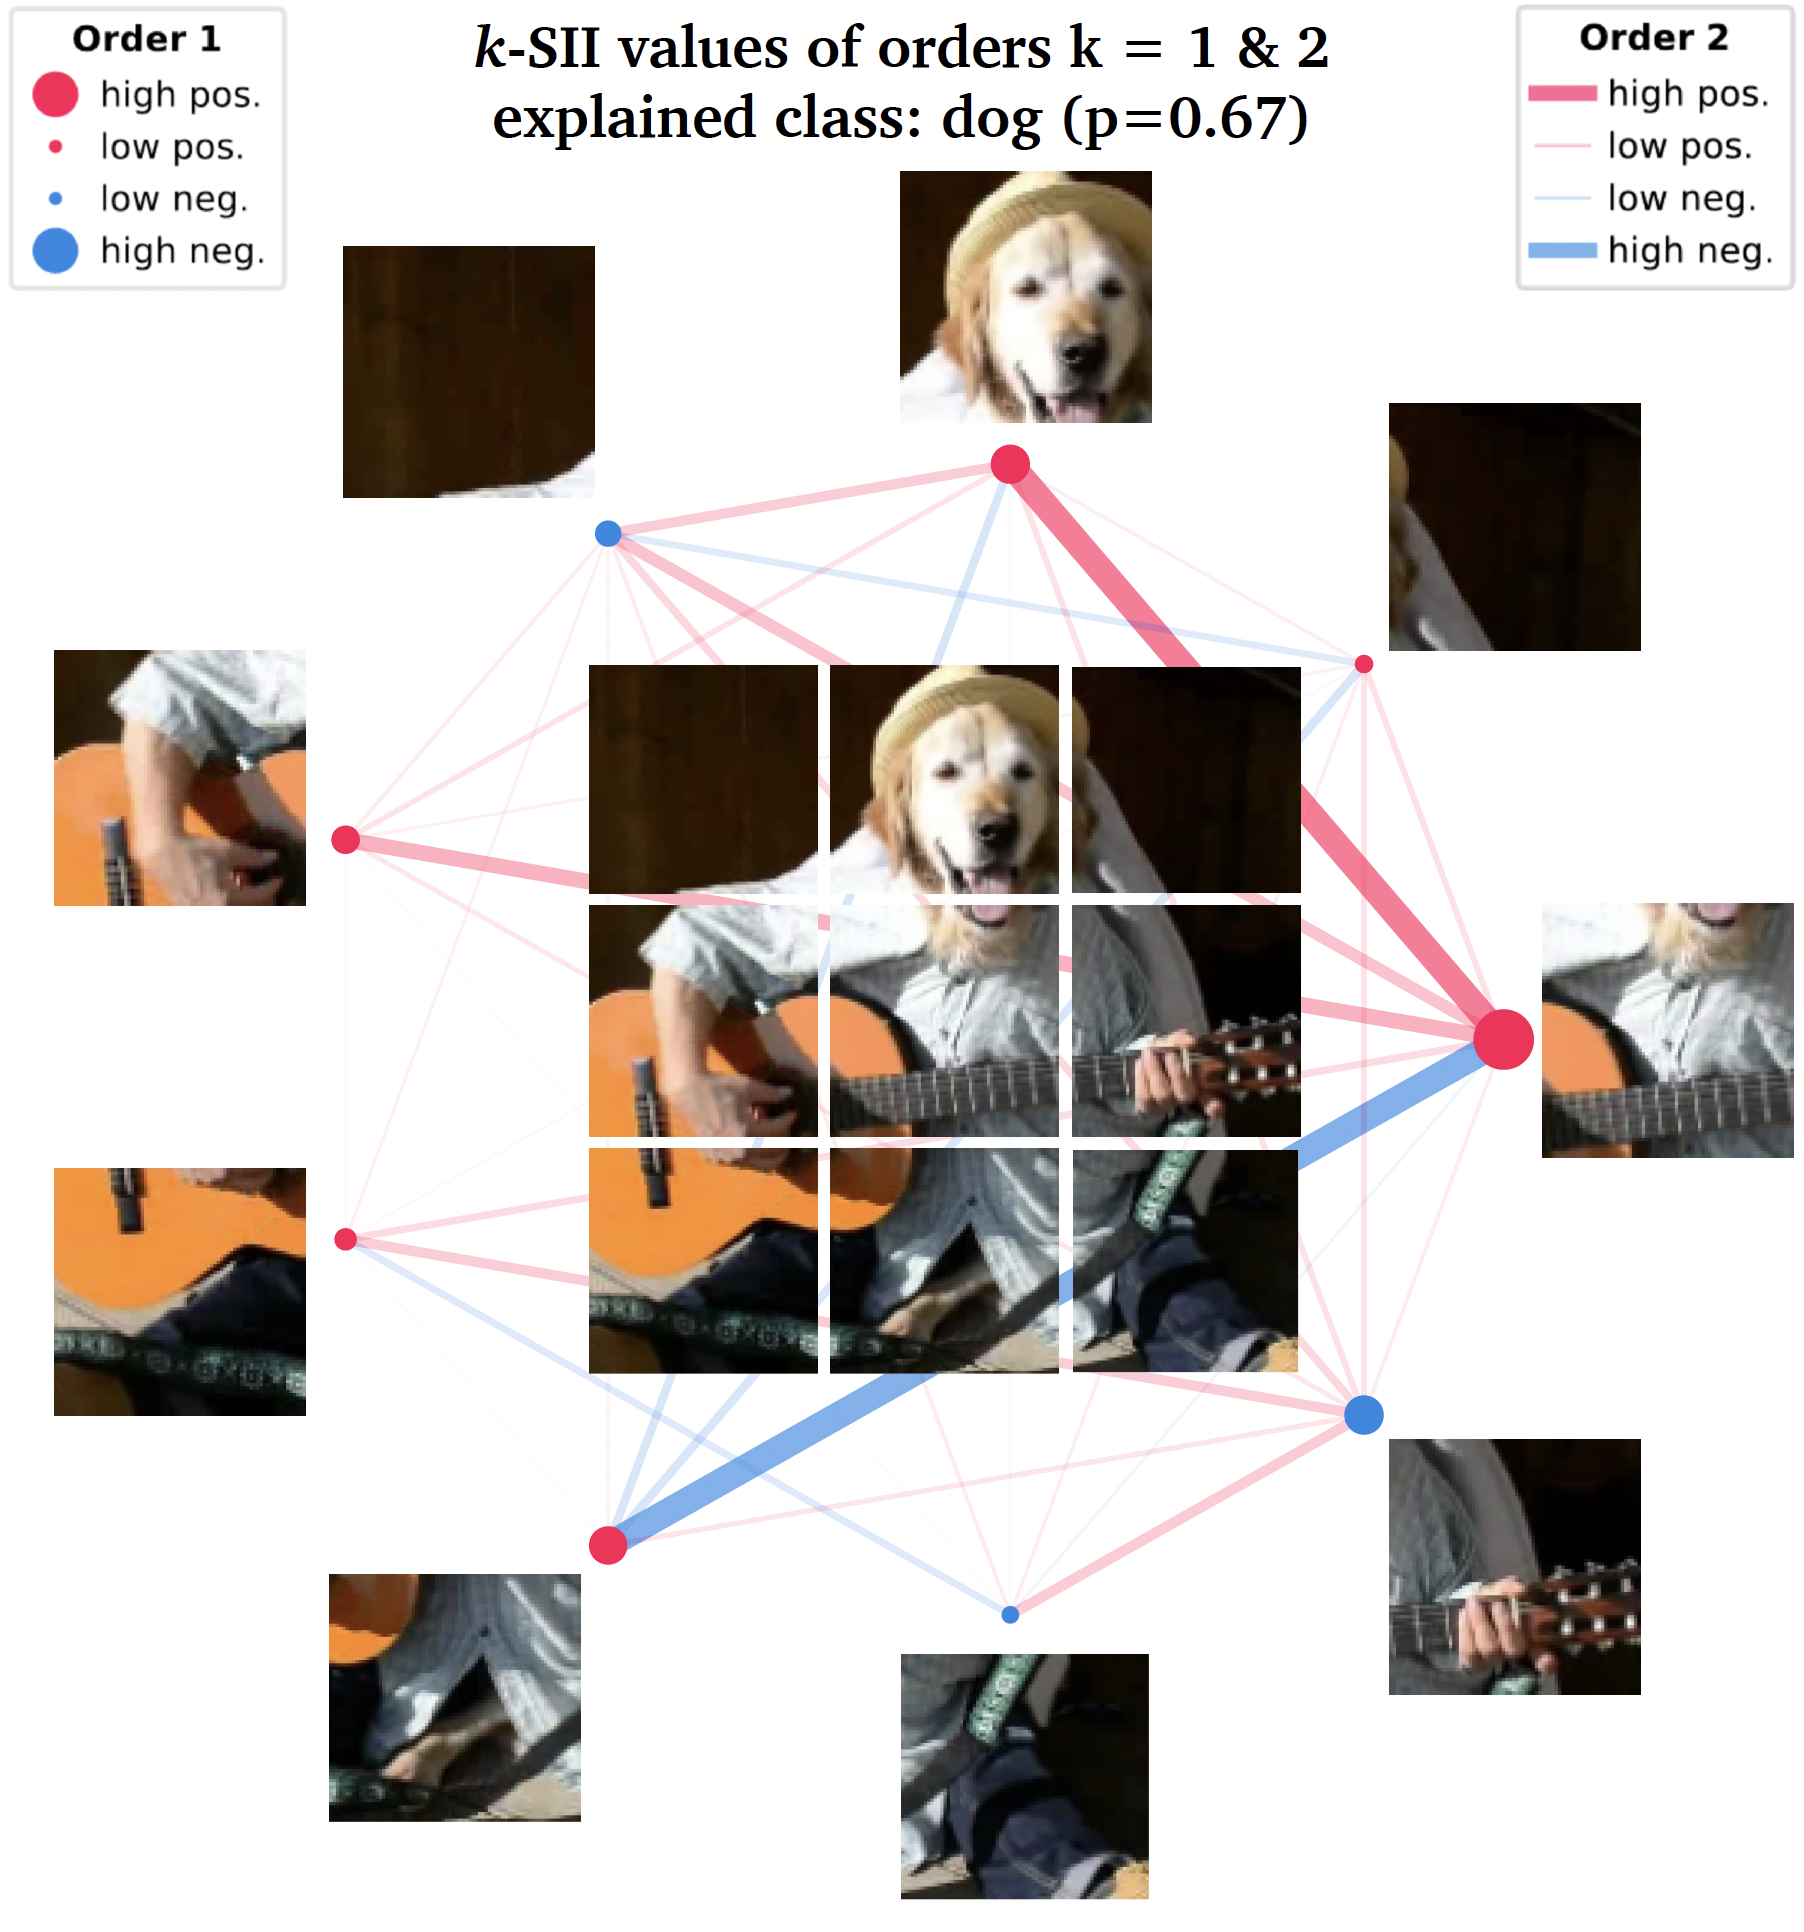
explanation = explainer.explain(data[0])A handy way of visualizing interaction scores up to order 2 are network plots. You can see an example of such a plot below. The nodes represent feature attributions and the edges represent the interactions between features. The strength and size of the nodes and edges are proportional to the absolute value of attributions and interactions, respectively.
shapiq.network_plot(
    first_order_values=interaction_values.get_n_order_values(1),
    second_order_values=interaction_values.get_n_order_values(2)
)
# or use
interaction_values.plot_network()
The pseudo-code above can produce the following plot (here also an image is added):
With shapiq you can also explain TabPFN by making use of the remove-and-recontextualize explanation paradigm implemented in shapiq.TabPFNExplainer.
import tabpfn, shapiq
data, labels = ...                    # load your data
model = tabpfn.TabPFNClassifier()     # get TabPFN
model.fit(data, labels)               # "fit" TabPFN (optional)
explainer = shapiq.TabPFNExplainer(   # setup the explainer
    model=model,
    data=data,
    labels=labels,
    index="FSII"
)
fsii_values = explainer.explain(data[0])  # explain with Faithful Shapley values
fsii_values.plot_force() # plot the force plotThe documentation of shapiq can be found at https://shapiq.readthedocs.io.
If you are new to Shapley values or Shapley interactions, we recommend starting with the introduction and the basic tutorials.
There is a lot of great resources available to get you started with Shapley values and interactions.
If you use shapiq and enjoy it, please consider citing our NeurIPS paper or consider starring this repository.
@inproceedings{Muschalik.2024b,
  title     = {shapiq: Shapley Interactions for Machine Learning},
  author    = {Maximilian Muschalik and Hubert Baniecki and Fabian Fumagalli and
               Patrick Kolpaczki and Barbara Hammer and Eyke H\"{u}llermeier},
  booktitle = {The Thirty-eight Conference on Neural Information Processing Systems Datasets and Benchmarks Track},
  year      = {2024},
  url       = {https://openreview.net/forum?id=knxGmi6SJi}
}We welcome any kind of contributions to shapiq!
If you are interested in contributing, please check out our contributing guidelines.
If you have any questions, feel free to reach out to us.
We are tracking our progress via a project board and the issues section.
If you find a bug or have a feature request, please open an issue or help us fixing it by opening a pull request.
This project is licensed under the MIT License.
This work is openly available under the MIT license. Some authors acknowledge the financial support by the German Research Foundation (DFG) under grant number TRR 318/1 2021 – 438445824.
Built with ❤️ by the shapiq team.


