The Expense Chart App is a web application built with React, Tailwind CSS, and Vite. It provides a user-friendly interface to visualize and analyze expenses over different time periods.
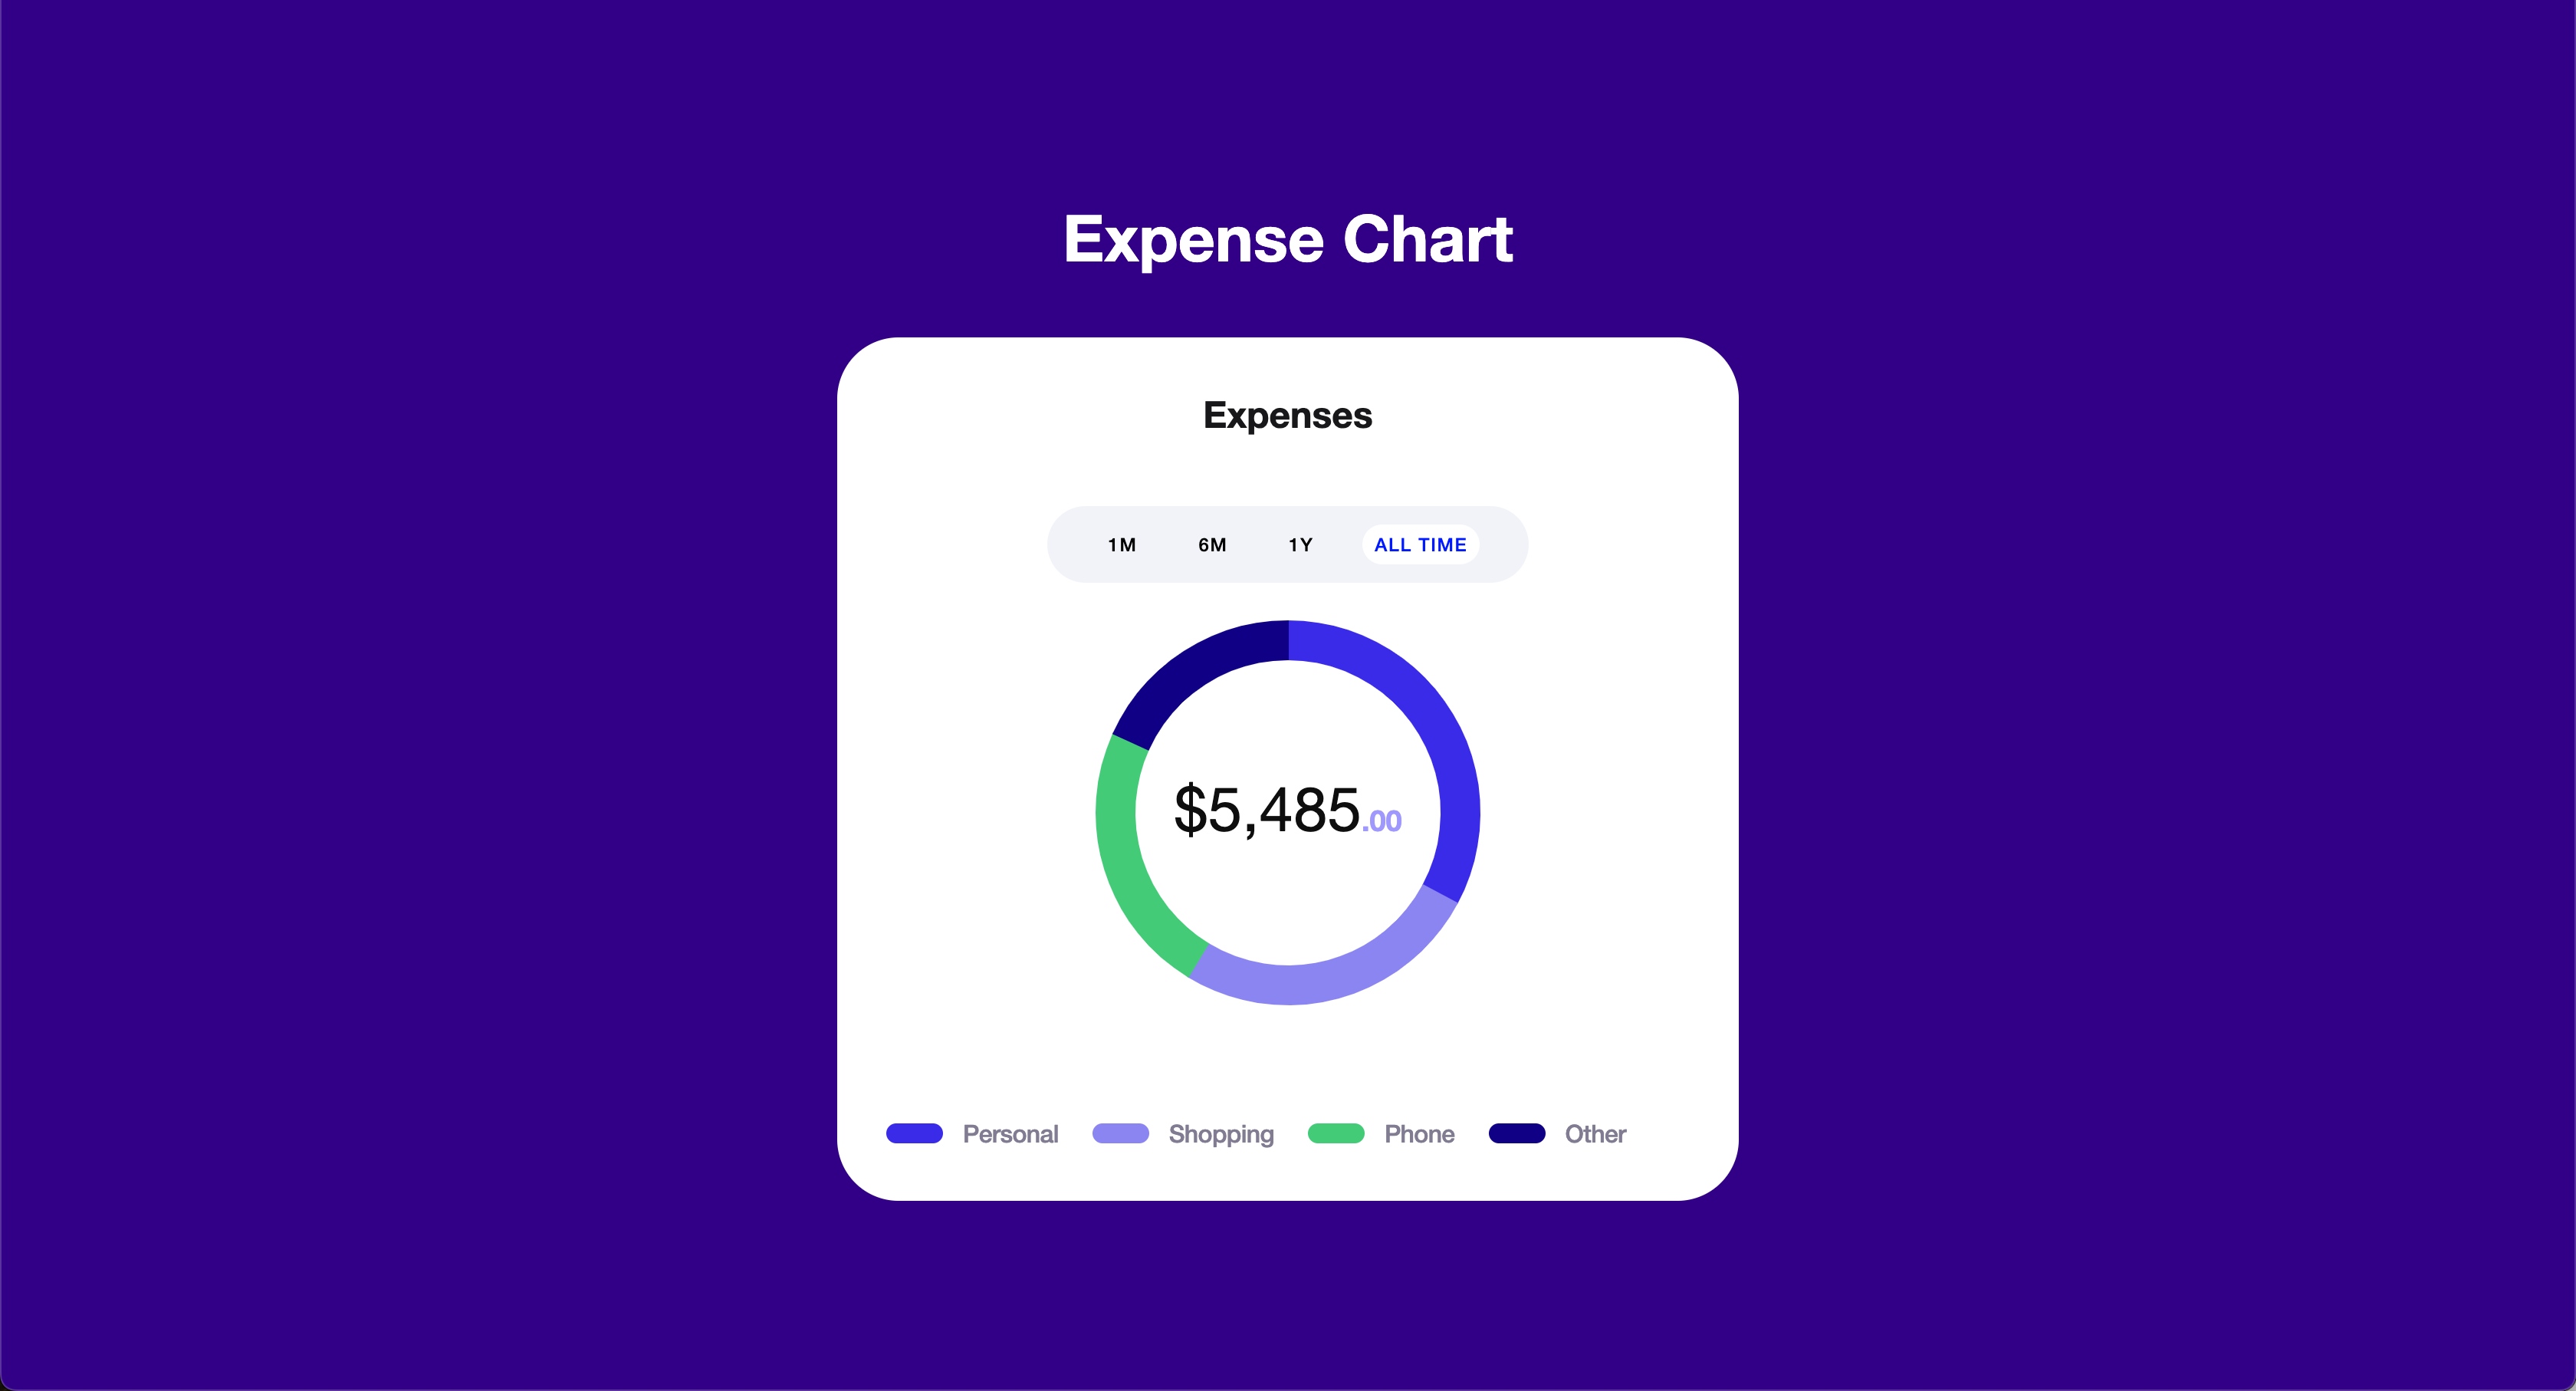
Live Demo: expense-chart
To install the app locally, follow these steps:
-
Clone the repository
git clone https://github.com/minhazurrony/expense-chart.git -
Navigate to the project directory
cd expense-chart -
Install dependencies
npm install
- src: Contains the source code of the application.
- components: React components used in the app.
- utils: Utility functions or helper modules.
- App.js: Main React component.
- index.js: Entry point for the application.
- public: Static assets.
- vite.config.js: Configuration file for Vite.
- package.json: Project configuration and dependencies.
- README.md: Project documentation.
The Expense Chart App relies on the following key dependencies:
- React: A JavaScript library for building user interfaces.
- Tailwind CSS: A utility-first CSS framework.
- Vite: A fast development server and bundler.
For a complete list of dependencies, refer to the
package.jsonfile in the project.
To start the development server, run the following command:
npm run dev
This will launch the app in development mode.
To build the app for production, use the following command:
npm run build
This will generate a dist directory containing the optimized and minified production build.
For deployment, you can use platforms like Netlify, Vercel, or GitHub Pages.
This project is licensed under the MIT License.