The purpose of this repository is to showcase 3 Financial Algorithms: Bollinger Bands, EMA10 RSI14, and LSTM Machine Learning.
Bollinger Bands: This is a strategy where the 20 day simple moving average is calculated, along with the the 20 day standard deviation. Using this, the upper and lower bands of the Bollinger Bands are calculated. The upper band is 2 standard deviations above the mean, and the lower band is 2 standard deviations below the mean. Using these 2 bands, the algorithm is created. When the closing price for a day goes below the lower band, a buy call is issued at market price for the next open. When the closing price for a day goes above the upper band, given that the algorithm is holding, a sell call is issued at market price for the next open. Along with this, 2 methods of of stop loss are implemented. The first is a 30% stop loss, where if a 20% loss is detected then a sell call is issued, and no trading occurs for 5 trading days. The second is a 50% stop loss, where if a 70% loss is detected then a sell call is issued and all trading halts.
EMA10 RSI14: This strategy is where the the 10 day exponential moving average is calculated, along with the 14 day exponential Relative strength index(RSI). The RSI is a indicator of whether the stock is overbought or oversold, 100 being overbought and 0 being oversold. Using these 2 numbers, the algorithm is created. When the closing price for a day goes below the EMA10 and the RSI is below 30, then a buy call is issued at market price for the next open. When the closing price for a day goes above the EMA10 and the RSI is above 70, a sell call is issued at market price for the next open. Along with this, 2 methods of of stop loss are implemented. The first is a 30% stop loss, where if a 20% loss is detected then a sell call is issued, and no trading occurs for 5 trading days. The second is a 50% stop loss, where if a 70% loss is detected then a sell call is issued and all trading halts.
LSTM Machine Learning: This is a simple modeling strategy where the Long Short-Term Memory(LSTM) model trains on past data, and looks to analyze future data. The LSTM model is made 3 LSTM Modules with 50 neurons each. This is then connected to a single Dense neuron. The data is the open, high, low, and volume for a given day of training, and it is looking to predict the close price for the next day. The data is split up into a 65% training and 35% testing. The model is trained with a batch size of 8 for 100 epochs. Afterwards, the model predicts the closing price on new data.
Bollinger Bands:
MSFT was used to backtest, starting from 2020-01-01 to current date.
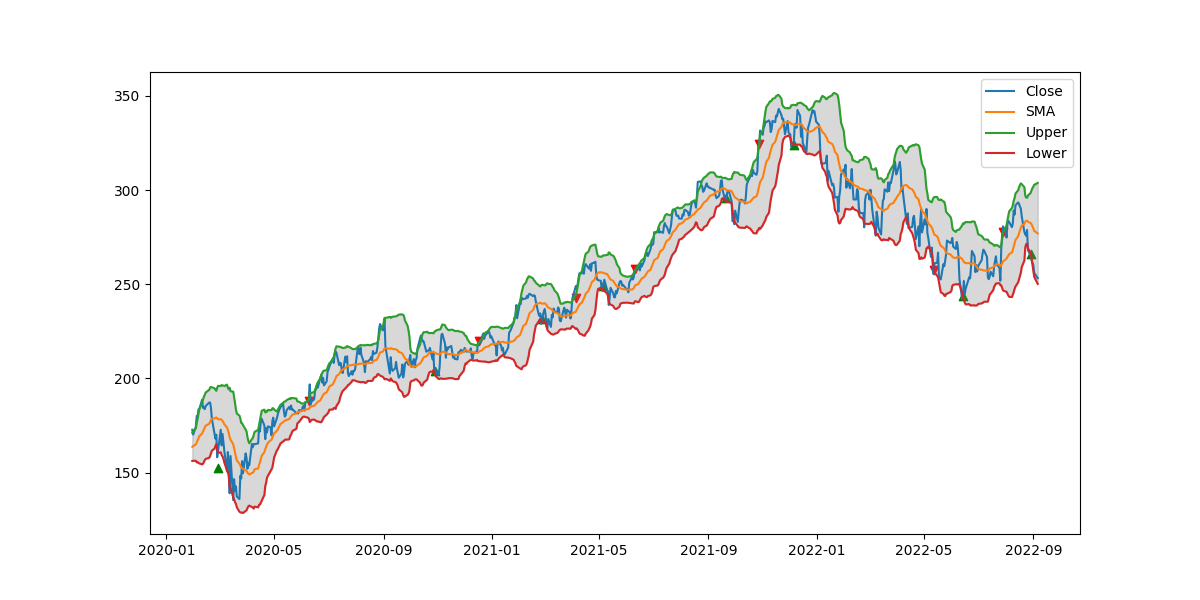 Total Profit was: 43.23%
EMA10 RSI14:
TSLA was used to backtest, starting from 2020-01-01 to current date.
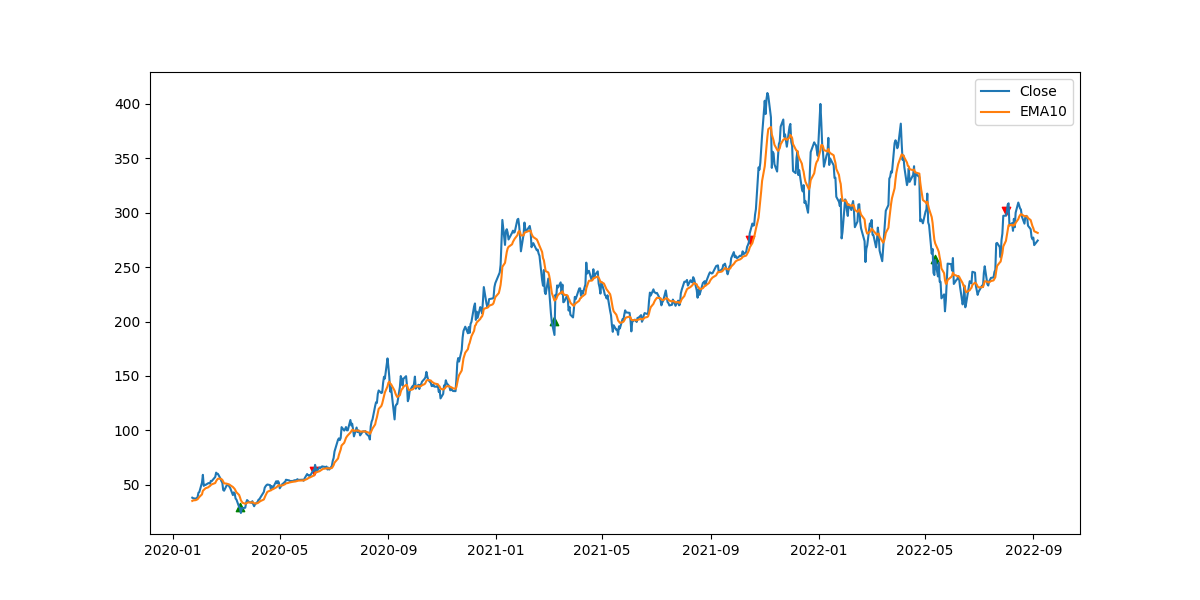 Total Profit was: 242.41%
LSTM Machine Learning:
Google was used to backtest, starting from 2020-01-01 to 2022-03-11
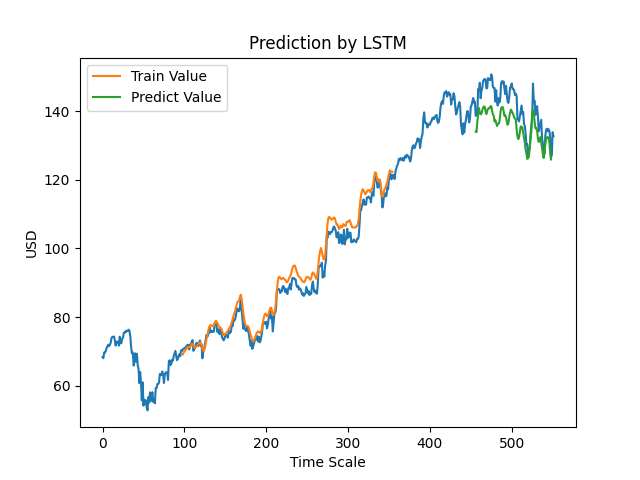
Prediction follows the actual values quite accurately.
There is 1 file in each folder. The files name is the same as the name of the algorithm. To run the algorithm simply run the program and response to the 2 prompts. The first is the ticket name, the second is the start date for the backtest. The output displays a graph of the trades along with a table of all of the trades and the total profit.
This was all written in Python 3.7.0 and in Tensorflow 2.