Plotting mass spectra with Matplotlib. The project provides a package to plot high-quality mass spectra for scientific papers and thesis.
Script for generating high-quality plots for mass spectra using python and matplotlib.
The package generates pdf or any other image format, which is provides by matplotlib. The scripts can be used for scientific publications with Latex support.
The package provides three different ways to plot and annotate a mass spectrum. Some examples can be found in the Usage section.
Properties
- All dimensions are defined in Millimeters.
- Import raw files from Bruker
- Automatic annotate a list of peaks from a text file.
- Manually annotate peaks
- Manually annotate distances between peaks
The MassSpectraPlot scripts need a Latex compiler for generating the plots. The scripts are tested on Windows using the Miktex package. But it should also work on any other system.
The script is programmed using Python 3 with the additional installed packages:
- numpy
- pandas
- matplotlib
A requirements.txt for virtualenv is also available in the repository.
The examples can be generated by executing the MassSpectraPlot.py script.
The MassSpectraPlot.py script contains three different examples for plotting a mass spectrum.
Every plot of a mass spectrum uses a ASCII based file with x/y data as inputs. This file must have the ending *.xy. An example of an input file can be found in the examples/inputs folder. The x and y values are divided by a space character.
For example the input data for the spectrum can be exported from Bruker Daltonics DataAnalysis. Using File -> Export -> Mass Spectrum -> Save as simple x-y ASCII File (*.xy) in the software to generate the appropriate file.
The automatic annotation of peaks, described in the next section, uses an additional input file. This file must have the same filename as the corresponding xy-file. The ending of the filename is *.txt. E.g., substance1.txt contains the peak labels for the spectra in substance1.xy.
This file is a comma-separated file with two colons. The first value is the x-value of the peak to be annotated and the second colon contains the label for the peak.
An example of this file can be found in examples/inputs folder.
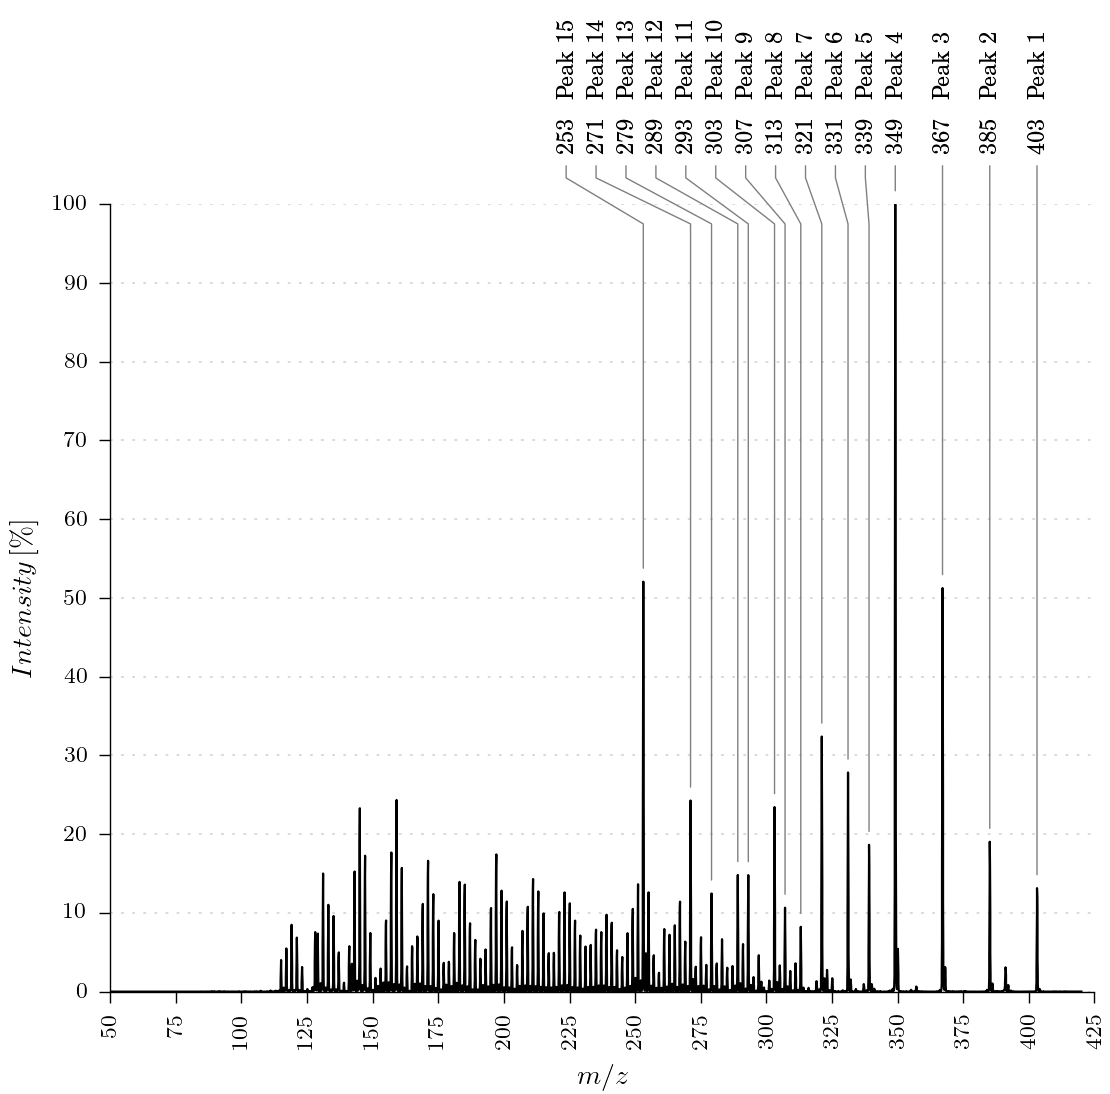
An example for automic generation of the labels is shown in method generate_massspectra_plot_automatic_labels(input_filename, output_filename).
The function will read the raw values and the label values from the input files. After that the function will generate all labels with a definated minimum distance (delta_x_text_labels_mm) between the labels.
A peak can be annotated with the function annotate_point. Therefore the x value of the point and the horizontal position of the label have to be given. By using the raw_values dataframe the function searches the peak next to the given x_value automatically.
The method generate_massspectra_plot_distance_peak_manual_annotation(input_filename, output_filename) shows the usage of the explained function.
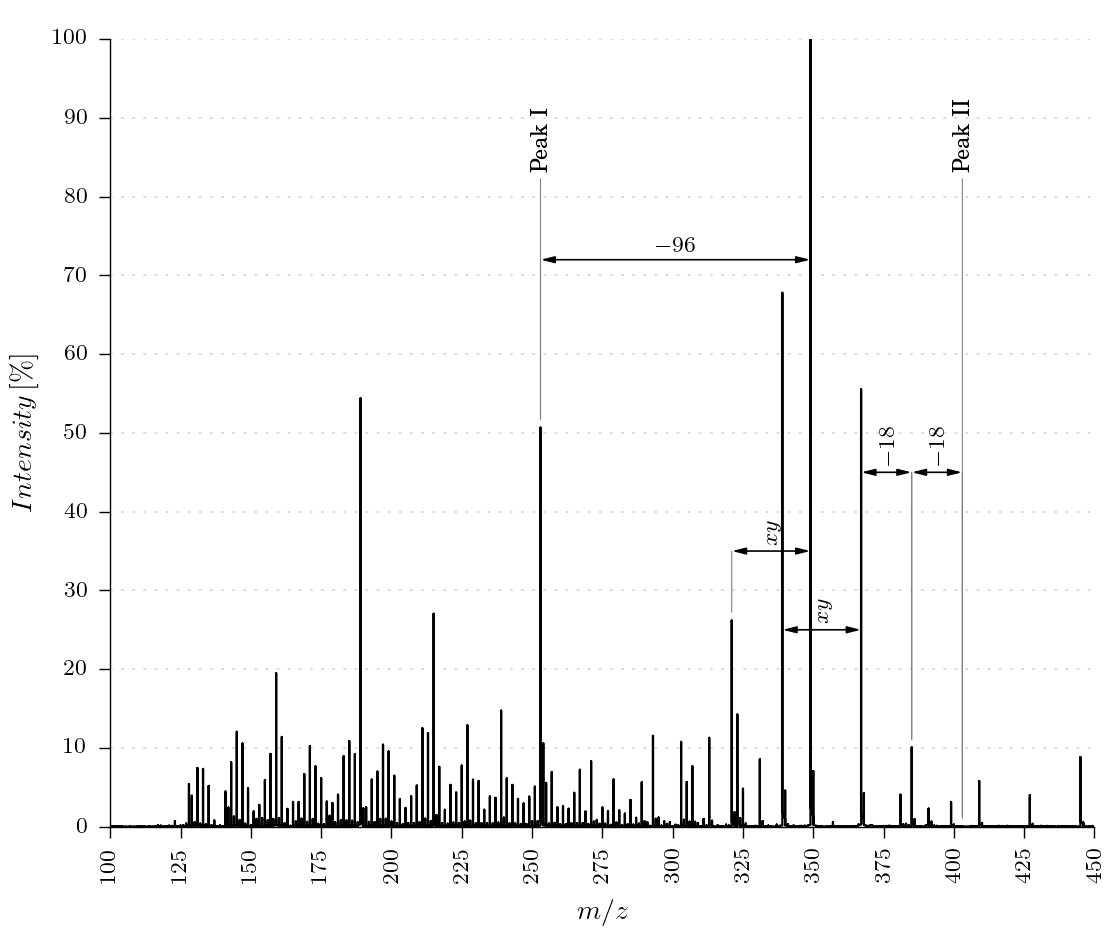
A distance between two peaks can be plotted by using the function annotate_distance.
An example is shown in the function generate_massspectra_plot_distance_peak_manual_annotation(input_filename, output_filename).
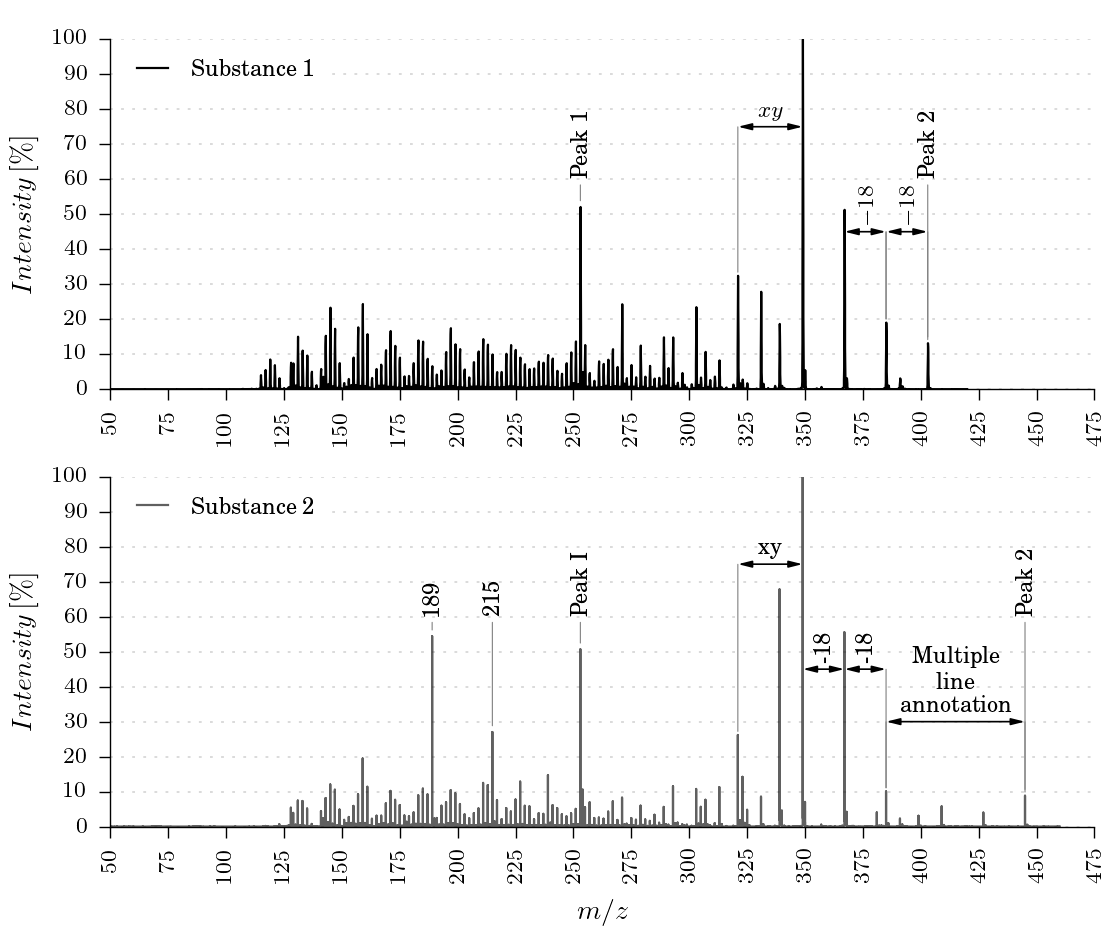
The function generate_massspectra_two_plot_manual_annotation(input_filename1, input_filename2, output_filename) plots two graphs vertically.
The margins and dimensions of the plots are given in millimeters and can be easily customized.
Feel free to contact me if you have questions or comments. It would be nice if you also share your results when using the scripts.
**The MIT License (MIT)**

Copyright (c) 2015 Martin Noehrer

Permission is hereby granted, free of charge, to any person obtaining a copy
of this software and associated documentation files (the "Software"), to deal
in the Software without restriction, including without limitation the rights
to use, copy, modify, merge, publish, distribute, sublicense, and/or sell
copies of the Software, and to permit persons to whom the Software is
furnished to do so, subject to the following conditions:

The above copyright notice and this permission notice shall be included in all
copies or substantial portions of the Software.

THE SOFTWARE IS PROVIDED "AS IS", WITHOUT WARRANTY OF ANY KIND, EXPRESS OR
IMPLIED, INCLUDING BUT NOT LIMITED TO THE WARRANTIES OF MERCHANTABILITY,
FITNESS FOR A PARTICULAR PURPOSE AND NONINFRINGEMENT. IN NO EVENT SHALL THE
AUTHORS OR COPYRIGHT HOLDERS BE LIABLE FOR ANY CLAIM, DAMAGES OR OTHER
LIABILITY, WHETHER IN AN ACTION OF CONTRACT, TORT OR OTHERWISE, ARISING FROM,
OUT OF OR IN CONNECTION WITH THE SOFTWARE OR THE USE OR OTHER DEALINGS IN THE
SOFTWARE.