![]()
The main purpose of this project is to create an open system for the management of a domestic heating system.
The system is open and provides an example through which it is possible to adapt it for each heating system. The system includes a puffer, solar panel and a boiler.

The management is carried out by an Arduino like system that allows you to detect temperatures and force the start-ups of the pumps remotely, via app, webserver or integration with alexa. In addition to temperature differences and heat losses the system also considers environmental conditions and weather previsions. In the initial phase, boiler management is not considered but its shutdown is only forced on the basis of weather information. The boiler managment is left to the solar control unit. This first phase involves a study of temperatures and heat losses and a data logging.
The first phase of data collection will be done using the SinricPro platform.

This follows from the experience gained during the tempcontrol project for an Environmental conditions measurement unit.
In a second phase this control will also be added.
The management of the heating of several rooms with radiators and the management of the air conditioners by means of an RF control will also be added.
The possibility to remotely control the data is also added thanks to a Mysql webserver:

This also allows you to have interactive charts:

The system also provides for the creation of chronothermostats and sensors for environmental well-being and comfort. Thermal safety devices and methane (or LPG) detectors will also be added.
Finally, after a long testing period, the system will also replace the solar control unit.
- Solar Heating Control Unit
- Introduction
- Let's Work
Different sensors are used:
- DHT11 for ambient temperature and humidity
- DS18B20 for water or pipe temperature
- CT Sensor for energy
Three different DS18B20s are used to sense the temperature from different temperature wells.

One in the upper part for the sanitary water outlet, one in the lower part for the solar inlet and the last in the central part where the boiler inlet is located.
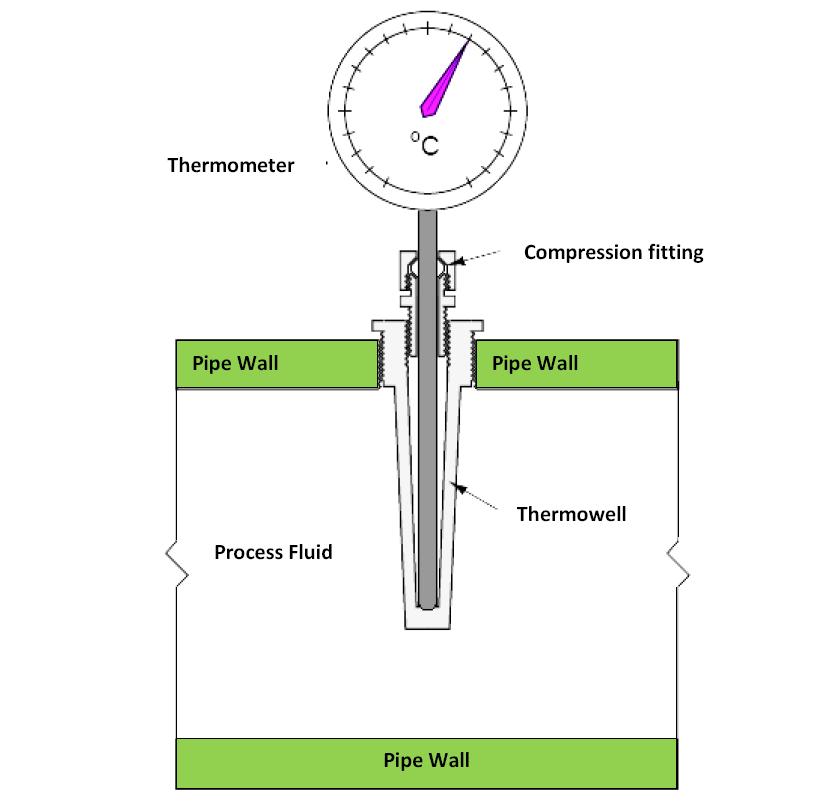
Additional DS18B20 can be positioned on the flow and return pipes from the boiler to collect interesting data.
I therefore present a summary of the sketch to read the data from multiple DS18B20 probes inserted in different thermowell.

The snippet for ESP8266 is the following and can be integrated both with the reading for alexa and with the local webserver, as presented below. To include it call dsaggiornamento() in the loop()section and update temperature data from tempvec[] elements.
#include <OneWire.h>
#include <DallasTemperature.h>
const int oneWireBus = D5; // GPIO where the DS18B20 is connected to
OneWire oneWire(oneWireBus);
DallasTemperature sensors(&oneWire);
int numberOfDevices;
float tempvec[] = {0, 0, 0, 0}; // set zero for all the sensor
DeviceAddress tempDeviceAddress;
...
void dsaggiornamento() {
  for (int i = 0; i < numberOfDevices; i++) {
    // Search the wire for address
    if (sensors.getAddress(tempDeviceAddress, i)) {
      // Output the device ID
      Serial.print("Temperature for device: ");
      Serial.println(i, DEC);
      // Print the data
      float tempC = sensors.getTempC(tempDeviceAddress);
      Serial.print("Temp C: ");
      Serial.println(tempC);
      tempvec[i] = tempC;
    }
  }
}
...

void ds_set() {
  sensors.begin();   // Start the DS18B20 sensor
  numberOfDevices = sensors.getDeviceCount();
  // Loop through each device, print out address
  for (int i = 0; i < numberOfDevices; i++) {
    // Search the wire for address
    if (sensors.getAddress(tempDeviceAddress, i)) {
      Serial.print("Found device ");
      Serial.print(i, DEC);
      Serial.print(" with address: ");
      printAddress(tempDeviceAddress);
      Serial.println();
    } else {
      Serial.print("Found ghost device at ");
      Serial.print(i, DEC);
      Serial.print(" but could not detect address. Check power and cabling");
    }
  }
}
The web server look like this:

The data can be saved into Mysql server, see below.
It is easy to insert new ds18B20 sensors simply by adding elements to the vector tempvec[i].
It is also included an lcd display.
//setup
...
if (!display.begin(SSD1306_SWITCHCAPVCC, 0x3C)) {
    Serial.println(F("SSD1306 allocation failed"));
    for (;;);
  }
  delay(2000);
  display.clearDisplay();
  display.setTextColor(WHITE);
...

// to display call mostra()
void mostra() {

display.clearDisplay(); display.setTextSize(1);  display.setCursor(0, 0);  display.print("T ambiente: "); display.setTextSize(1);   display.print(tempvec[2]);  display.print(" ");  display.setTextSize(1);  display.cp437(true);  display.write(167);  display.setTextSize(1);  display.print("C");  display.display();

display.setTextSize(1);  display.setCursor(0, 20);  display.print("Caldaia: ");  display.setTextSize(1);   display.print(tempvec[1]);  display.print(" ");  display.setTextSize(1);  display.cp437(true);  display.write(167);  display.setTextSize(1);  display.print("C"); display.display();

 display.setTextSize(1);  display.setCursor(0, 30);  display.print("Boiler: ");  display.setTextSize(1); display.print(tempvec[0]);  display.print(" ");  display.setTextSize(1);  display.cp437(true);  display.write(167);  display.setTextSize(1);  display.print("C");  display.display();

display.setTextSize(1);  display.setCursor(0, 40);  display.print("Solare: ");  display.setTextSize(1);  display.print(tempvec[3]);  display.print(" ");  display.setTextSize(1);  display.cp437(true);  display.write(167);  display.setTextSize(1);  display.print("C");    display.display();

display.setTextSize(1);  display.setCursor(0, 50);  display.print("Humidity: ");  display.setTextSize(1);    display.print(h);  display.print(" %");  display.display();
}
Real application - Prototype no. 3 - Equipped with three probe for puffer, DHT11 (Sinric + Home Automation) for room temperature and humidity and lcd.
Ds18B20 with cable sensors is used to control the flow and return temperatures of the water from the boiler. This sensors allows easy contact with the copper tube, moreover it can be easily inserted between the pipe and the insulation.
The system uses the boiler to produce hot water and by means of a three-way valve decides whether to send it to the radiators or to the puffer. Therefore probes were added to monitor the outlet towards the radiators and the puffer and their returns. Another probe monitors the outlet directly from the boiler, before the valve.

Two different boards were developed connected by a 3.5mm jack. The first contains ESP8266 and the general system while the second contains the connection with the temperature probes. DHT22 it is also include to monitor enviromental temperature and humidity.

The code is similar to the one for monitoring the puffer.
This is also included with sinric and therefore with Alexa to intrude with home automation.
Real application - Prototype no. 2 - Equipped with five probe for boiler and DHT2 (Sinric + Home Automation) for outdoor temperature and humidity. In this example the five probes measure hot water outlet towards the radiators and the puffer and the inlet from the radiators and the puffer.

Home automation - Prototype no. 2 - Test for integration of the temperature and humidity detection system and video surveillance.

// Import required libraries
#include <Arduino.h>
#include <ESP8266WiFi.h>
#include <ESP8266HTTPClient.h>
#include <Hash.h>
#include <ESPAsyncTCP.h>
#include <ESPAsyncWebServer.h>
unsigned long timerino = 0;
unsigned long timerino2 = 5000;
#include "sinriclib.h"
#include "dallasens.h"
#include "dhtsense.h"
#include "sensdata.h"
#include "webpage.h"
//timer x database
unsigned long t2 = 0;
unsigned long dt = 0;
unsigned long t3 = 300000;//update database every 5 minutes
void setup() {
  Serial.begin(115200);
  dht.begin();
  ds_set();
  WiFi.begin(ssid, password);   // Connect to Wi-Fi
  Serial.println("Connecting to WiFi");
  while (WiFi.status() != WL_CONNECTED) {
    delay(1000);
    Serial.println(".");
  }
  Serial.println(WiFi.localIP());   // Print ESP8266 Local IP Address
  // Route for root / web page
  server.on("/", HTTP_GET, [](AsyncWebServerRequest * request) { request->send_P(200, "text/html", index_html, processor);  });
  server.on("/temp1", HTTP_GET, [](AsyncWebServerRequest * request) {request->send_P(200, "text/plain", String(tempvec[1]).c_str());  });
  server.on("/temp2", HTTP_GET, [](AsyncWebServerRequest * request) {request->send_P(200, "text/plain", String(tempvec[0]).c_str());  });
  server.on("/temp3", HTTP_GET, [](AsyncWebServerRequest * request) { request->send_P(200, "text/plain", String(tempvec[3]).c_str());  });
  server.on("/temp4", HTTP_GET, [](AsyncWebServerRequest * request) { request->send_P(200, "text/plain", String(tempvec[2]).c_str());  });
  server.on("/humidity", HTTP_GET, [](AsyncWebServerRequest * request) { request->send_P(200, "text/plain", String(h).c_str());  });
  server.begin();   // Start server
  setupSinricPro();
  delay(2000);
}

void loop() {
  SinricPro.handle();
  handleTemperaturesensor();
  if (millis() - timerino > timerino2) {
    sensors.requestTemperatures(); // Send the command to get temperatures
    dsaggiornamento();
    timerino = millis();
  }
  dht_reading();
  //Check WiFi connection status
  if (WiFi.status() == WL_CONNECTED) {
    HTTPClient http;
    http.begin(serverName);     // Your Domain name with URL path or IP address with path
    // Specify content-type header
    http.addHeader("Content-Type", "application/x-www-form-urlencoded");
    dt = millis() - t2;
    if (dt >= t3) {
      // Prepare your HTTP POST request data
      String httpRequestData = "api_key=" + apiKeyValue + "&value18=" + String(tempvec[0])
                               + "&value19=" + String(tempvec[1]) + "&value20=" + String(tempvec[2]) + "&value21=" + String(tempvec[3])
                               + "&value22=" + String(tempvec[4]) + "&value23=" + String(t) + "&value24=" + String(h) + "";
      Serial.print("httpRequestData: ");
      Serial.println(httpRequestData);
      int httpResponseCode = http.POST(httpRequestData);
      if (httpResponseCode > 0) {
        Serial.print("HTTP Response code: ");
        Serial.println(httpResponseCode);
      }
      else {
        Serial.print("Error code: ");
        Serial.println(httpResponseCode);
      }
      t2 = millis();
    }
    // Free resources
    http.end();
  }
}
For more information on the code : tempcontrol.it
This also include web page and home automation integration:

DHT Sensors are used to sense ambiente temperature and humidty. Different data from indoor and outdoor sensor are taken from different board.

Real application - Prototype no. 1 - First test board actually used inside electrical junction boxes, exposing the sensor to the environment.
The DHT11 was then replaced by a DHT22, much more precise.
| DHT11 | DHT22 | |
|---|---|---|
| Humidity range | 20-90% RH | 0-100% RH |
| Humidity accuracy | ±5% RH | ±2% RH |
| Temperature range | 0-50 °C | -40-80 °C |
| Temperature accuracy | ±2% °C | ±0.5% °C |
| Reading time | 6-10 sec | 2 sec |
There is at least one sensor for each floor of the house and one outdoor sensor.

Other interesting information is drawn from the CT sensor to analyze the energy consumption of boilers and pumps, to analyze their power on state and for other interesting calculations
This type of flow sensor is designed to measure the volume of liquid traveling past a given point, a great way to keep tabs on how much water your drip irrigation system is using, or any other project were the flow of liquid needs to be tracked. We like this basic flow sensors because of its relatively low cost and ease of use.

Next we are going to use a 10K Ohm resistor (Brown, Black, Orange) as a pull up resistor. The pull up resistor prevents a situation where the Arduino digital input pin ends up floating (think of this as the input not definitively being on or off). When an input is floating it may hold the last value, it may flip between off and on, quite random – generally not a good thing when we are trying to tell if it is on or off!
We know that this sensor will output a pulse to Arduino pin 2 every time the flapper rotates and every and that every rotation means 2.25mL of fluid has passed the sensor so calculating the flow rate is really just a matter of counting the revolutions per minute and multiplying by 2.25mL . So, what is the best way to count RPM with an Arduino? In this case the interrupt pin is going to be very useful.
int flowPin = 2;    //This is the input pin on the Arduino
double flowRate;    //This is the value we intend to calculate.
volatile int count; //This integer needs to be set as volatile to ensure it updates correctly during the interrupt process.

void setup() {
  // put your setup code here, to run once:
  pinMode(flowPin, INPUT);           //Sets the pin as an input
  attachInterrupt(0, Flow, RISING);  //Configures interrupt 0 (pin 2 on the Arduino Uno) to run the function "Flow"
  Serial.begin(9600);  //Start Serial
}
void loop() {
  // put your main code here, to run repeatedly:
  count = 0;      // Reset the counter so we start counting from 0 again
  interrupts();   //Enables interrupts on the Arduino
  delay (1000);   //Wait 1 second
  noInterrupts(); //Disable the interrupts on the Arduino

  //Start the math
  flowRate = (count * 2.25);        //Take counted pulses in the last second and multiply by 2.25mL
  flowRate = flowRate * 60;         //Convert seconds to minutes, giving you mL / Minute
  flowRate = flowRate / 1000;       //Convert mL to Liters, giving you Liters / Minute

  Serial.println(flowRate);         //Print the variable flowRate to Serial
}

void Flow()
{
   count++; //Every time this function is called, increment "count" by 1
}Also GAS (methane of LPG) sensor can be added for extra alarm and emergency shutdown.
Relays controlled by a transistor are used to activate particular outputs such as pumps, solenoid valves or clean contacts. Any circuits will be discussed on a case-by-case basis
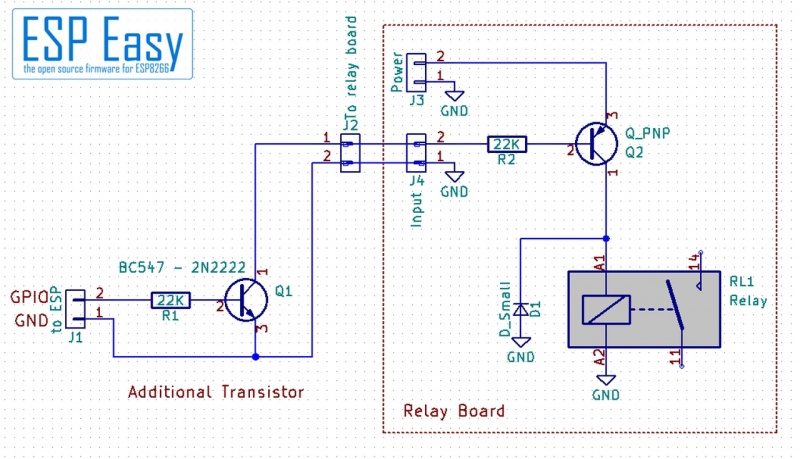
For the circuit diagram thanks to letscontrolit.com
For general sensor reading search in example folder
In this case a wemos D32 is used. To use it with Arduino IDE instal ESP8266 Library and select NodeMCU 1 (ESP-12E) board. It is also important to install CH340G driver. Use this link esp8266 package to add board manager and after install esp8266.

Circuit diagram

To read DHT11 is used DTH library from Adafruit. Frist include library and define pin
#include "DHT.h"
#define DHTTYPE DHT11
DHT dht(DHTPIN, DHTTYPE);
// Reading temperature or humidity takes about 250 milliseconds!
// Sensor readings may also be up to 2 seconds 'old' (its a very slow sensor)
float h = dht.readHumidity();
// Read temperature as Celsius (the default)
float t = dht.readTemperature();
Define variables and print it with:
Serial.print(h)
Serial.print(t)
For other info DHT11 Reading Example
The web server can be accessed with any device that has a browser on your local network. This is an asynchronous web server that update data automatically without need to refresh the web page and with custom CSS to style the web page.
Complete description in: ESP8266 Web Server Extra

DS18B20 hand held to see temperature difference
Install the DHT library by Adafruit.
Follow the next step to install the ESPAsyncWebServer library:
- Download AsyncWebServer library
- Unzip the .zip folder
- Rename your folder from
ESPAsyncWebServer-masterto ESPAsyncWebServer - Move the ESPAsyncWebServer folder to your Arduino IDE installation libraries folder
Follow the next step to install the ESPAsync TCP Library:
- Download ESPAsync TCP library
- Unzip
- Rename your folder from
ESPAsyncTCP-masterto ESPAsyncTCP - Move the ESPAsyncTCP folder to your Arduino IDE installation libraries folder Restard Arduino IDE.
The example code is presented in esp8266 example folder
Insert wifi credentials!
const char* ssid = "REPLACE_WITH_YOUR_SSID";
const char* password = "REPLACE_WITH_YOUR_PASSWORD";
The webpage include heading and differents paragraph to display sensor data.There are also two icons to style the page.
All the HTML text with styles included is stored in the index_html variable. Now we’ll go through the HTML text and see what each part does.
<p>
  <i class="fas fa-thermometer-half" style="color:#059e8a;"</i>
  <span class="dht-labels">Temperature</span>
  <span id="temperature">%TEMPERATURE%</span>
  <sup class="units">°C</sup>
</p>
For automatic updates ther's some JavaScript code in our web page that updates the temperature and humidity automatically, every 10 seconds. Scripts in HTML text should go between the <script></script> tags.
Example for temperature:
<script>
setInterval(function ( ) {
  var xhttp = new XMLHttpRequest();
  xhttp.onreadystatechange = function() {
    if (this.readyState == 4 && this.status == 200) {
      document.getElementById("temperature").innerHTML = this.responseText;
    }
  };
  xhttp.open("GET", "/temperature", true);
  xhttp.send();
}, 10000 ) ;
To update data on the background, there is a setInterval() function that runs every 10 seconds.
Basically, it makes a request in the /data URL to get the latest data:
  xhttp.open("GET", "/data", true);
  xhttp.send();
}, 10000 ) ;
When it receives that value, it updates the HTML element whose id is data.
if (this.readyState == 4 && this.status == 200) {
  document.getElementById("temperature").innerHTML = this.responseText;
}
Another important function is processor() function, that will replace the placeholders in our HTML text with the actual temperature and humidity values.
String processor(const String& var){
  //Serial.println(var);
  if(var == "TEMPERATURE"){
    return String(t);
  }
  else if(var == "DATA"){
    return String(data);
  }
  return String();
}
When the web page is requested, we check if the HTML has any placeholders. If it finds the %DATA% placeholder, we return the temperature that is stored on the data variable.
In setup() there are different initializations.
Connection to your local network and print the ESP8266 IP address:
WiFi.begin(ssid, password);
while (WiFi.status() != WL_CONNECTED) {
  delay(1000);
  Serial.println("Connecting to WiFi..");
}
And the code to handle the web server.
When we make a request on the root URL, we send the HTML text that is stored on the index_html variable. We also need to pass the processor function, that will replace all the placeholders with the right values.
server.on("/", HTTP_GET, [](AsyncWebServerRequest *request){
  request->send_P(200, "text/html", index_html, processor);
});
Add additional handlers to update the temperature and humidity readings. When we receive a request on the /data URL, we simply need to send the updated temperature value. It is plain text, and it should be sent as a char, so, we use the c_str() method.
server.on("/data", HTTP_GET, [](AsyncWebServerRequest *request){
  request->send_P(200, "text/plain", String(data).c_str());
});
Start webserver
server.begin();It is recommended to print the sensor data on the serial monitor through the loop() for a debug function.
Create variabile for data reading and update it in loop()
float data = 0;Ad paragraph and placeholder into HTML section:
<p>
<i class="fas fa-temperature-high" style="color:#b32d00;"></i>
<span class="dht-labels">Data</span>
<span id="dataid">%DATA%</span>
<sup class="units">°C</sup>
</p>Ad section into <script> block for the placeholder:
setInterval(function ( ) {
  var xhttp = new XMLHttpRequest();
  xhttp.onreadystatechange = function() {
    if (this.readyState == 4 && this.status == 200) {
      document.getElementById("dataid").innerHTML = this.responseText;
    }
  };
  xhttp.open("GET", "/data", true);
  xhttp.send();
}, 10000) ;
Ad else if section into processor():
else if (var == "DATA") { // DHT humidity
    return String(data);
  }
Another options is to obtain sensor data with a specially created function and update it in this last section taking its data as a string. Suppose this function called specialfunction() this last paragraph would be:
else if (var == "DATA") { // DHT humidity
    return String(specialfunction());
  }
For other info to ESP8266 Web Server Extra
Thanks to Rui Santos. For other information and code comments DHT11 ESP8266 Web Server
Install library for DS18B20: install OneWire from library manager. Install Dallas Temperature library by Miles Burton from library manager.
Include library and define pin:
#include <OneWire.h>
#include <DallasTemperature.h>
// GPIO where the DS18B20 is connected to
const int oneWireBus = D5;
Setup comincation:
OneWire oneWire(oneWireBus);
DallasTemperature sensors(&oneWire);
In the setup() section start sensors and serial.
Request temperature with:
sensors.requestTemperatures();
float temperatureC = sensors.getTempCByIndex(0);
For other info DS18B20 Reading Exampe

The section for ESP 32 will be updated soon.
For integration with Alexa we will use the functions offered by Sinric Pro.
Sinric pro is a very practical platform that allows us to connect the development board to Alexa and Google Home. The first step is to create an account on Sinric Pro.
For the wifi connection, DHT reading and calbe connection we use the same web server procedure indicated above.
Install and include library and dependencies for SinricPro:
#include <SinricPro.h>
#include "SinricProTemperaturesensor.h"
Define the following constants available from the web page of your Sinric account:
#define APP_KEY           "YOUR-APP-KEY"
#define APP_SECRET        "YOUR-APP-SECRET"
#define TEMP_SENSOR_ID    "YOUR-DEVICE-ID"
bool deviceIsOn;                              // Temeprature sensor on/off state
float lastTemperature;                        // last known temperature (for compare)
float lastHumidity;                           // last known humidity (for compare)
#define EVENT_WAIT_TIME   60000               // send event every 60 seconds
unsigned long lastEvent = (-EVENT_WAIT_TIME); // last time event has been sent
There are other important function like onPowerState() that callback for setPowerState request parameters and return true if request should be marked as handled correctly / false if not. The handleTemperatatureSensor() that checks if Temperaturesensor is turned on, get actual temperature and humidity and check if these values are valid and send event to SinricPro Server if temperature or humidity changed. The setupSinricPro() to inizialize Sinric comunciation.
So they look like:
bool onPowerState(const String &deviceId, bool &state) {
  Serial.printf("Temperaturesensor turned %s (via SinricPro) \r\n", state ? "on" : "off");
  deviceIsOn = state; // turn on / off temperature sensor
  return true; // request handled properly
}

void handleTemperaturesensor() {
  if (deviceIsOn == false) return; // device is off...do nothing

  unsigned long actualMillis = millis();
  if (actualMillis - lastEvent < EVENT_WAIT_TIME) return; //only check every EVENT_WAIT_TIME milliseconds

  t = dht.readTemperature();          // get actual temperature in °C
  //  temperature = dht.getTemperature() * 1.8f + 32;  // get actual temperature in °F
  h = dht.readHumidity();                // get actual humidity

  if (isnan(t) || isnan(h)) { // reading failed...
    Serial.printf("DHT reading failed!\r\n");  // print error message
    return;                                    // try again next time
  }

  if (t == lastTemperature || h == lastHumidity) return; // if no values changed do nothing...

  SinricProTemperaturesensor &mySensor = SinricPro[TEMP_SENSOR_ID];  // get temperaturesensor device

  bool success = mySensor.sendTemperatureEvent(t, h); // send event
  if (success) {  // if event was sent successfuly, print temperature and humidity to serial
    Serial.printf("Temperature: %2.1f Celsius\tHumidity: %2.1f%%\r\n", t, h);
  } else {  // if sending event failed, print error message
    Serial.printf("Something went wrong...could not send Event to server!\r\n");
  }

  lastTemperature = t;  // save actual temperature for next compare
  lastHumidity = h;        // save actual humidity for next compare
  lastEvent = actualMillis;       // save actual time for next compare
}


// setup function for SinricPro
void setupSinricPro() {
  // add device to SinricPro
  SinricProTemperaturesensor &mySensor = SinricPro[TEMP_SENSOR_ID];
  mySensor.onPowerState(onPowerState);

  // setup SinricPro
  SinricPro.onConnected([]() {
    Serial.printf("Connected to SinricPro\r\n");
  });
  SinricPro.onDisconnected([]() {
    Serial.printf("Disconnected from SinricPro\r\n");
  });
  SinricPro.begin(APP_KEY, APP_SECRET);
  SinricPro.restoreDeviceStates(true); // get latest known deviceState from server (is device turned on?)
}
Include in setup() the setupSinricPro() function.
Call in loop() the function:
  SinricPro.handle();
handleTemperaturesensor(); It's possibile to add Sinric Pro skills in Alexa app and login with Sinric credential to add device.

It's possibile to download the Sinric Pro App or to login into SinricPro website to visualize sensor data log for different time period.

Other information and complete sketch in esp8266 sinric example folder
This code will be integrated with that of the web server.
For remote control it is ideal to have a remote web server that collects the data and allows you to view them comfortably.
The following section explains how to initialize your server to have good graphs of the data with different time intervals.
Here is an example of a code used to send the data of two probes used in the puffer. Refer to the puffer section for how to get the data.
For more information and a more in-depth guide refer to the section private domain server into tempcontrol project
The goal of this section is to have your own domain name and hosting account that allows you to store sensor readings from the ESP32 or ESP8266. You can visualize the readings from anywhere in the world by accessing your own server domain.
In this guide is used Siteground hosting.
After signing up for a hosting account and setting up a domain name, you can login to your cPanel or similar dashboard. After that, follow the next steps to create your database, username, password and SQL table.
Add an user username and set a password. You must save all those details, because you’ll need them later to establish a database connection with your PHP code.
That’s it! Your new database and user were created successfully. Now, save all your details because you’ll need them later:
- Database name:
example_esp_data - Username:
example_esp_board - Password:
your password
After creating your database and user, go back to cPanel dashboard and search for “phpMyAdmin”.
CREATE TABLE Sensor (
    id INT(6) UNSIGNED AUTO_INCREMENT PRIMARY KEY,
    value1 VARCHAR(10),
    value2 VARCHAR(10),
    reading_time TIMESTAMP DEFAULT CURRENT_TIMESTAMP ON UPDATE CURRENT_TIMESTAMP
)
So create a PHP script that receives incoming requests from the ESP32 or ESP8266 and inserts the data into a MySQL database.
Create a new file in /public_html with this exact name and extension: post-data.php
PHP Create New file post data .php Edit the newly created file (post-data.php) and copy the following snippet:
<?php
$servername = "localhost";
$dbname = "REPLACE_WITH_YOUR_DATABASE_NAME";
$username = "REPLACE_WITH_YOUR_USERNAME";
$password = "REPLACE_WITH_YOUR_PASSWORD";
$api_key_value = "tPmAT5Ab3j7A8";
$api_key = $value1 = $value2 = "";
if ($_SERVER["REQUEST_METHOD"] == "POST") {
    $api_key = test_input($_POST["api_key"]);
    if($api_key == $api_key_value) {
        $value1 = test_input($_POST["value1"]);
        $value2 = test_input($_POST["value2"]);
        // Create connection
        $conn = new mysqli($servername, $username, $password, $dbname);
        // Check connection
        if ($conn->connect_error) {
            die("Connection failed: " . $conn->connect_error);
        }
        $sql = "INSERT INTO Sensor (value1, value2)
        VALUES ('" . $value1 . "', '" . $value2 . "')";
        if ($conn->query($sql) === TRUE) {
            echo "New record created successfully";
        }
        else {
            echo "Error: " . $sql . "<br>" . $conn->error;
        }
        $conn->close();
    }
    else {
        echo "Wrong API Key provided.";
    }
}
else {
    echo "No data posted with HTTP POST.";
}
function test_input($data) {
    $data = trim($data);
    $data = stripslashes($data);
    $data = htmlspecialchars($data);
    return $data;
}
Create another PHP file in the /public_html directory that will plot the database content in a chart on a web page. Name your new file: esp-chart.php
<?php
$servername = "localhost";
$dbname = "REPLACE_WITH_YOUR_DATABASE_NAME";
$username = "REPLACE_WITH_YOUR_USERNAME";
$password = "REPLACE_WITH_YOUR_PASSWORD";
// Create connection
$conn = new mysqli($servername, $username, $password, $dbname);
// Check connection
if ($conn->connect_error) {
    die("Connection failed: " . $conn->connect_error);
}
$sql = "SELECT id, value1, value2, reading_time FROM Sensor order by reading_time desc limit 40";
$result = $conn->query($sql);
while ($data = $result->fetch_assoc()){
    $sensor_data[] = $data;
}
$readings_time = array_column($sensor_data, 'reading_time');
$value1 = json_encode(array_reverse(array_column($sensor_data, 'value1')), JSON_NUMERIC_CHECK);
$value2 = json_encode(array_reverse(array_column($sensor_data, 'value2')), JSON_NUMERIC_CHECK);
$reading_time = json_encode(array_reverse($readings_time), JSON_NUMERIC_CHECK);
$result->free();
$conn->close();
?>

<!DOCTYPE html>
<html>
<meta name="viewport" content="width=device-width, initial-scale=1">
  <script src="https://code.highcharts.com/highcharts.js"></script>
  <style>
    body {
      min-width: 310px;
    	max-width: 1280px;
    	height: 500px;
      margin: 0 auto;
    }
    h2 {
      font-family: Arial;
      font-size: 2.5rem;
      text-align: center;
    }
  </style>
  <body>
    <h2>TEMPCONTROL</h2>
    <div id="chart-temperature1" class="container"></div>
    <div id="chart-temperature2" class="container"></div>
<script>

var value1 = <?php echo $value1; ?>;
var value2 = <?php echo $value2; ?>;
var reading_time = <?php echo $reading_time; ?>;

var chartT = new Highcharts.Chart({
  chart:{ renderTo : 'chart-temperature' },
  title: { text: 'Temperature Boiler1' },
  series: [{
    showInLegend: false,
    data: value1
  }],
  plotOptions: {
    line: { animation: false,
      dataLabels: { enabled: true }
    },
    series: { color: '#059e8a' }
  },
  xAxis: {
    type: 'datetime',
    categories: reading_time
  },
  yAxis: {
    title: { text: 'Temperature (Celsius)' }
    //title: { text: 'Temperature (Fahrenheit)' }
  },
  credits: { enabled: false }
});

var chartT = new Highcharts.Chart({
  chart:{ renderTo : 'chart-temperature2' },
  title: { text: 'Temperature Boiler2' },
  series: [{
    showInLegend: false,
    data: value2
  }],
  plotOptions: {
    line: { animation: false,
      dataLabels: { enabled: true }
    },
    series: { color: '#059e8a' }
  },
  xAxis: {
    type: 'datetime',
    categories: reading_time
  },
  yAxis: {
    title: { text: 'Temperature (Celsius)' }
    //title: { text: 'Temperature (Fahrenheit)' }
  },
  credits: { enabled: false }
});
</script>
</body>
</html>The same previous code is used with some additions:
Include new library:
#include <ESP8266HTTPClient.h>;Inizialize new variables:
const char* serverName = "http://yourdomain.it/post-data.php";
String apiKeyValue = "tPmAT5Ab3j7F8";
unsigned long t2=0;
unsigned long dt=0;
unsigned long t3 = 300000;//update database every 5 minutes
Add this snippet in the loop()section:
//Check WiFi connection status
  if (WiFi.status() == WL_CONNECTED) {
    HTTPClient http;

    // Your Domain name with URL path or IP address with path
    http.begin(serverName);

    // Specify content-type header
    http.addHeader("Content-Type", "application/x-www-form-urlencoded");
    dt=millis()-t2;
    if (dt>= t3) {
      // Prepare your HTTP POST request data
      String httpRequestData = "api_key=" + apiKeyValue + "&value1=" + String(temp1)
                               + "&value2=" + String(temp2)  + "";
      Serial.print("httpRequestData: ");
      Serial.println(httpRequestData);

      if (httpResponseCode > 0) {
        Serial.print("HTTP Response code: ");
        Serial.println(httpResponseCode);
      }
      else {
        Serial.print("Error code: ");
        Serial.println(httpResponseCode);
      }
      t2=millis();
    }
    // Free resources
    http.end();
  }
WARNING! It's important to update
temp1andtemp2variables from sensor reading. See the puffer section for example for the puffer example.
The charts looks like this:

It is interesting to be able to observe the graph for different time intervals.
To do it copy esp-chart.php into new file and change the following lines:
$sql = "SELECT id, value1, value2, value3, reading_time FROM Sensor3 order by reading_time desc limit 24";In this case the number 24 represents 2 hours of data reading. As it is set up (t3=300000) the sensor uploads a reading to the server every 5 minutes. It is possible to set different times intervals.
Set:
72for 6 hours and save it asesp-chart-1d.php288for 24 hoursesp-chart-1d.php
Now add buttons:
Add some css style into esp-chart.php:
 .containerbt {
    height: 100px;
    position: relative;
    }

    .center {
      margin: 0;
      position: absolute;
      top: 50%;
      left: 50%;
      -ms-transform: translate(-50%, -50%);
      transform: translate(-50%, -50%);
    }
    .button {
      position: relative;
      background-color: #4CAF50;
      border: none;
      font-size: 20px;
      color: #FFFFFF;
      padding: 20px;
      width: 150px;
      text-align: center;
      -webkit-transition-duration: 0.4s; /* Safari */
      transition-duration: 0.4s;
      text-decoration: none;
      overflow: hidden;
      cursor: pointer;
      border-radius: 10px;
    }

    .button:after {
      content: "";
      background: #90EE90;
      display: block;
      position: absolute;
      padding-top: 300%;
      padding-left: 350%;
      margin-left: -20px!important;
      margin-top: -120%;
      opacity: 0;
      transition: all 0.8s
    }

    .button:active:after {
      padding: 0;
      margin: 0;
      opacity: 1;
      transition: 0s
    }
  .button:hover {background-color: #3e8e41}
And add link in the <body>section:
<h2>Temp control</h2>
    <div class="containerbt">
      <div class="center">
        <a class="button" href="http://tempcontrol.it/esp-chart-6h.php">6 Ore</a>
        <a class="button" href="http://tempcontrol.it/esp-chart-1d.php">24 Ore</a>
      </div>
    </div>
Look like this and it is fully personalizable.

First of all it is obvious the possibility of optimizing everything by transferring it to a PCB circuit, eliminating all that is useless and using only the devices necessary for operation. This certainly implies an increase in production costs but would allow to reduce the dimensions by a lot.
It is clear that a larger scale production must first be evaluated and certainly not for the test phase.
The next improvement will be the creation of an ad hoc network so that the devices communicate with each other with a proprietary protocol and then one (or more) hubs actually connect to the Wi-Fi, wired or GSM network.
- @mastroalex
- Graphic Design - @Alina Elena Mihai
- Hosting and server setting @letoinformatics
For supplies of material and technical help @termoclimaservice