Logistic regression is a type of statistical analysis which is used in classification task. It tries to predict discrete outcome/ class given the query point.
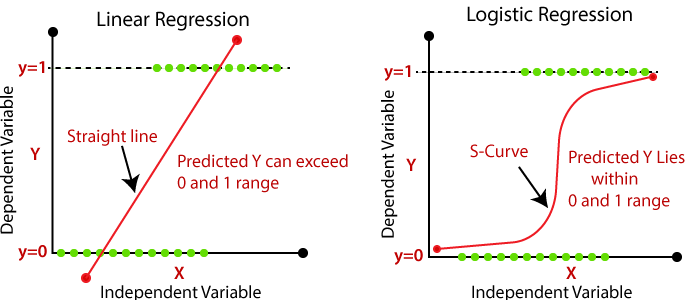
Unlike linear regression which tries to predict continuous output by exploring the relationship between continuous dependent variable and one or more independent variable, LR outcome is discrete (one of many discrete values). Logistic regression measures the relationship between the categorical dependent variable and one or more independent variables by estimating probabilities using a logistic/sigmoid function.
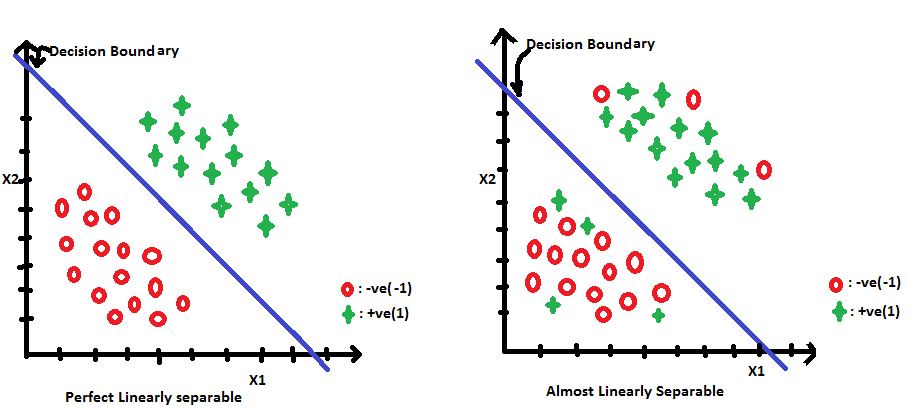
Logistic regression assumes that the data is linearly separable or almost linearly separable.
The objective function of LR is to minimize the misclassification or to maximize the correct classification. Here is the simple loss function: (assuming hyperplane passes through origin and there is no bias term in "Wt * Xi + b"
Objective function that maximizes correct classifications

The problem with maximizing the above object function is, It is prone to outliers. One outlier can change whole decision boundary with this objective function, if the value of on of the Xi is huge, the whole expression will blow up and the resultant hyperplane might be wrong.
Impact of outlier in hyperplane given above objective function

The above hyperplane (horizontal yellow line) yields -90 as loss value, but is reasonably good as the classification accuracy is 10/11.
Now here comes the problem:

The above hyperplane yields 1 as loss value, but is not good hyperplane as the accuracy is 6/11.
To mitigate the impact of outlier we introduce sigmoid function
To reduce the impact of outlier on the decision boundary, we squash the logits in the range of [0-1].
so our loss function becomes:

There is still an issue with the above loss function, which is It is non-convex. To make it convex, We pass the sigmoid function via Log transformation, as sigmoid and loss function, both are monotonic function, the output will have same relative meaning.
Finally our loss function becomes:

Maximizing F(x) is same as minimizing -F(x)

Geometric and Probabilistic formulation

The Reason we use sigmoid function is to mitigate the impact of outlier which might change our hyperplane while optimizing the objective function. Sigmoid function does this by squashing extreme positive values towards 1 and extreme negative values towards 0, so that extreme values will have less impact on hyperplane.
It also has nice property of probabilistic interpretation. Values by sigmoid function can also be interpreted as probability of a point belonging to positive class.

- It is used to mitigate the impact of outlier on the decision surface
- It is differentiable and hence optimization algorithms like vanilla gradient decent is easily possible.
- Provides probabilistic interpretation of a data point belonging to a positive class.
As we are using gradient descent to find the optimum parameter values which would result in minimum loss, its best to make our loss function as convex as possible (U shaped) so that we don't get stuck at saddle point or local minima (when we can do better).
We use log of sigmoid so that our objective function becomes convex (having just one minima/ maxima) to run optimization algorithm like gradient decent easily. So for "+" and "-" class, loss function would look like:

Sigmoid itself is a non linear, non convex function, if you apply gradient decent directly on sigmoid expression it would result in non-convex space which could result in non optimal results. Even though there are ways to get around this problem but they are not perfect either, like using SGD with momentum, ADAM optimizer etc. But if we could make problem simpler, we should go for it.
As our loss function looks like this:

* Note: The above expression ignores bias term
Here is the derivative w.r.t weights:

Here is the derivative of w.r.t bias:

-
We take log of sigmoid to make objective function convex as sigmoid itself is a non-convex function, to make optimization easy, we apply log on the top of sigmoid.
-
It is monotonic function and hence is flexible to be applied on any other function without messing with the original function itself.
-
As function is convex, we can apply vanilla gradient descent to optimize this function.

Weight vector are the list of values that our algorithm tries to learn to minimize the loss
As the feature value f1 increases and corresponding w1 is positive then probability of point being positive also increases.
As the feature value f1 increases and corresponding w1 is negative then probability of point being negative increases.
As the feature value f1 decreasing and corresponding w1 is positive then probability of point being positive also decreases.
As the feature value f1 decreasing and corresponding w1 is negative then probability of point being positive increases.
Collinearity or multi-collinearity (collinearity across multiple features) (features are not independent)
Many algorithm assumes that feature are independent of each other. It is important because, independent feature should be independent, If they depend upon each other (a feature can be predicted by linearly combining the some other features) , This might lead to wrong interpretation and hence wrong conclusions (ie, getting feature importance)
Colinear features are the features which can be predicated (linearly) using other feature (a single feature) eg x1 = A * x5 + B. Colinear features are linearly corelated with other features. Multicollinear features are the features which could be linearly combined to predict other feature (single feature) eg x1 = x2+ B * x3.
Due to collinearity (or multi collinearity), weight vectors can't be trusted to determine feature importance, as weight values might change on each run or two different but same estimator might have different weight vectors. For this reason multi colinear is a problem because it introduces chaos regarding "what feature to trust".
Perturbation technique: It is a technique where you train multiple models, one on original data and other on perturbated data (noisy). Perturbated data is the original data with some noise added. If weight vectors of both the models are significantly different then our dataset contains colinear features.
Using forward/ backward feature selection: As the feature importance by the model can't be trusted in the case of multi-collinearity, we may use forward or backward feature selection to get feature importance.
Variance Inflation Factor: It is another way to detect multi-collinearity.
- Collinearity/ Multicollinearity is a situation when an independent variable can be predicted by linearly combining other independent variables.
- It is a problem in modelling the assumptions because different model (with same assumptions) might give different results.
- Weight vectors can change arbitrarily and hence feature importance can't be trusted anymore
- Same model might produce different weight vector on multiple runs
- Use perturbation technique to detect collinearity, if weight vectors of two models differs significantly, then it denotes our dataset contains colinear features
- Use forward feature selection to get feature importance
- Use VIF to detect and remove multi-colinear features
It is easy to get feature importance in the logistic regression, But be cautious, not every feature has to be trusted.
Basically, We take the absolute value of weight vector, the more "weight" value corresponding feature has, the more contribution that feature is making towards decision making and hence more important that feature is.
- Feature importance is obtained by taking absolute value of weight vectors and choosing top values.
- For top n feature importance of positive class we take top n highest values from the raw weight vectors
- For top n feature importance of negative class we take top n lowest values from the raw weight vectors
- Assumes features to be independent of each other (no collinearity or multi collinearity is present)
- Absolute value of weights vectors to determine feature importance can only be trust if feature are independent
- Should not use absolute value of weight values for feature importance when there is collinearity in the data
Train time complicity: O(n * d) (per epoch) because we need to go via all the training set and d multiplication and addition.
Run time complicity (time complexity): O(d) (per data point) because we need to perform d multiplication and d additions.
Space complexity: O(d) because we need to store weight vector w which has d dimensions.
-
Logistic regression is a linear classification algorithm, can be used when data is perfectly or almost linearly separable.
-
Should not be used when data is non linear (unless some transformation is applied to data, like polynomial transformation), it would result in high bias (under fitting).
-
-
It uses logistic function (sigmoid) to mitigate outlier effect (changing whole decision boundary while aiming for maximizing correctly classified points) and gives probabilistic interpretation of a point belonging to positive class.
-
Uses log on the top of logistic function to make it convex and hence convergence is easy using gradient based method.
-
Gradient descent can be used easily as it has one local minima.
-
-
Easier and faster to train. Can be used for low latency applications as it has fast runtime time.
-
Feature importance can be easily obtained, as high parameter(weight) value of corresponding feature contribute more towards decision making.
-
Feature importance should not be trusted when features are colinear, because weights can be vary arbitrary.
-
As it is a distance based algorithm (unlike tree based like decision tree), feature should be normalized (or standardized) before training begins.
-
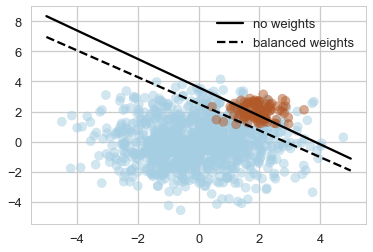
LR is sensitive to class imbalance, class imbalance effect the decision boundary because LR will always try to focus on separating majority class to achieve low error and the algorithm has seen many instance of the majority class hence the influence of majority class will be high.
-
Can somewhat mitigate impact of outlier because of sigmoid squashing but is not fully resilient to them. LR is sensitive to outlier as huge outlier can pull and change the decision boundary.