I wanted to have the statistics of Unbound in Grafana and since I didn't want to modify my Unbound Docker Image to use any third party tools like Zabbix sender, I found a way to get them into the Zabbix database and ship the stats to Grafana.
Zabbix active agents can ingest files, so Unbound-Control creates a file with the statistics using a modified healthcheck script and an active Zabbix agent reads and processes the log and saves the values into the Zabbix database.
Adapt the unbound.conf to enable extended statistics:
server:
  extended-statistics: yes
  statistics-cumulative: no
  statistics-interval: 0
Download the modified healthcheck.sh script and place it in your persistent Unbound volume.
You also need to modify your unbound compose and add the following lines to the volumes section.
 unbound:
    container_name: unbound
    image: madnuttah/unbound:latest
    ...
    volumes:

      ...
      - ./unbound/healthcheck.sh:/usr/local/unbound/sbin/healthcheck.sh:rw
      - ./unbound/log.d/unbound-stats.log:/usr/local/unbound/log.d/unbound-stats.log:rw
      ...
    healthcheck:
      test: /usr/local/unbound/sbin/healthcheck.sh
      interval: 60s
      retries: 5
      start_period: 15s
      timeout: 30s
Create an Active Zabbix agent on the docker host where Unbound runs on.
Map the unbound-stats.log to the agent's volumes in it's compose like so:
  zabbix-agent2:
    image: zabbix/zabbix-agent2:alpine-6.4-latest
    ...
    volumes:
      ...
      - ./unbound/log.d/unbound-stats.log:/var/log/unbound-stats.log:ro
      - /var/run/docker.sock:/var/run/docker.sock:ro
Download my Zabbix template and import it into your host in Zabbix.
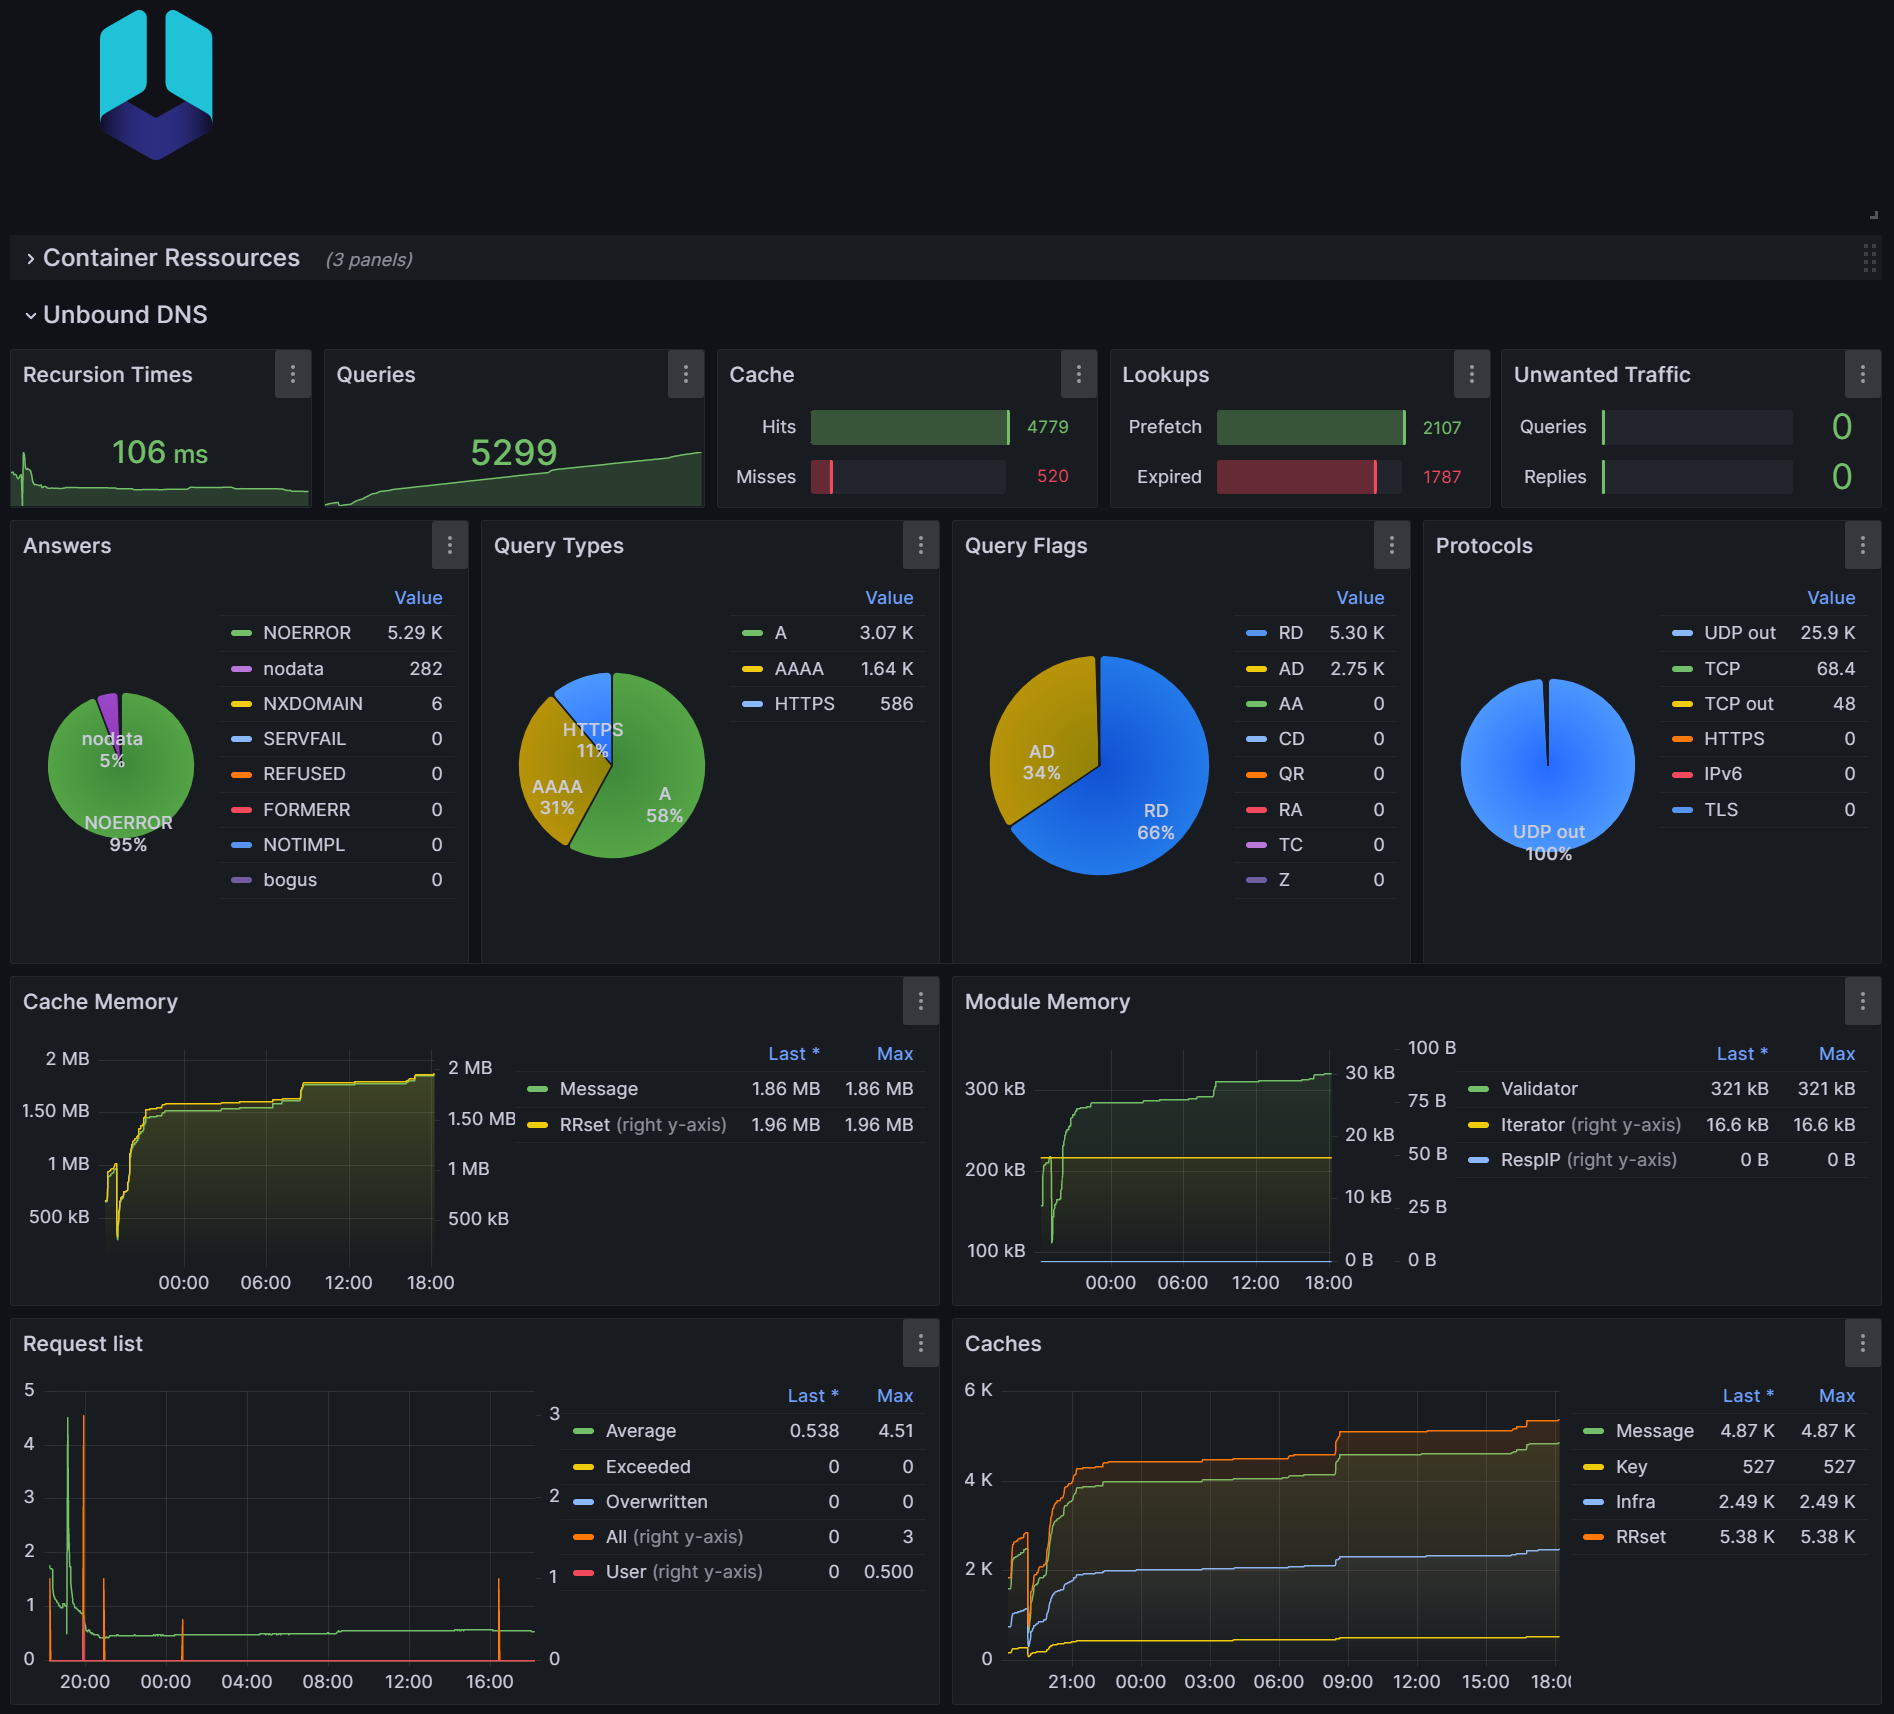
Zabbix should display values in Latest Data after a little while and you can now begin to configure your Grafana panels or Zabbix graphs as you like.
I guess there are many things to optimize or to make better, there are no graphs or such for Zabbix or completed panels for Grafana for example. If you like to contribute, you're most welcome.
This was tested only with Zabbix 6.4 using madnuttah/unbound-docker.