Author: Ricardo Cachucho([email protected]), Kaihua Liu([email protected])
| Modules |
|---|
 |
| Pre-processing | Segmentation | Bi-clustering |
|---|---|---|
 |
 |
 |
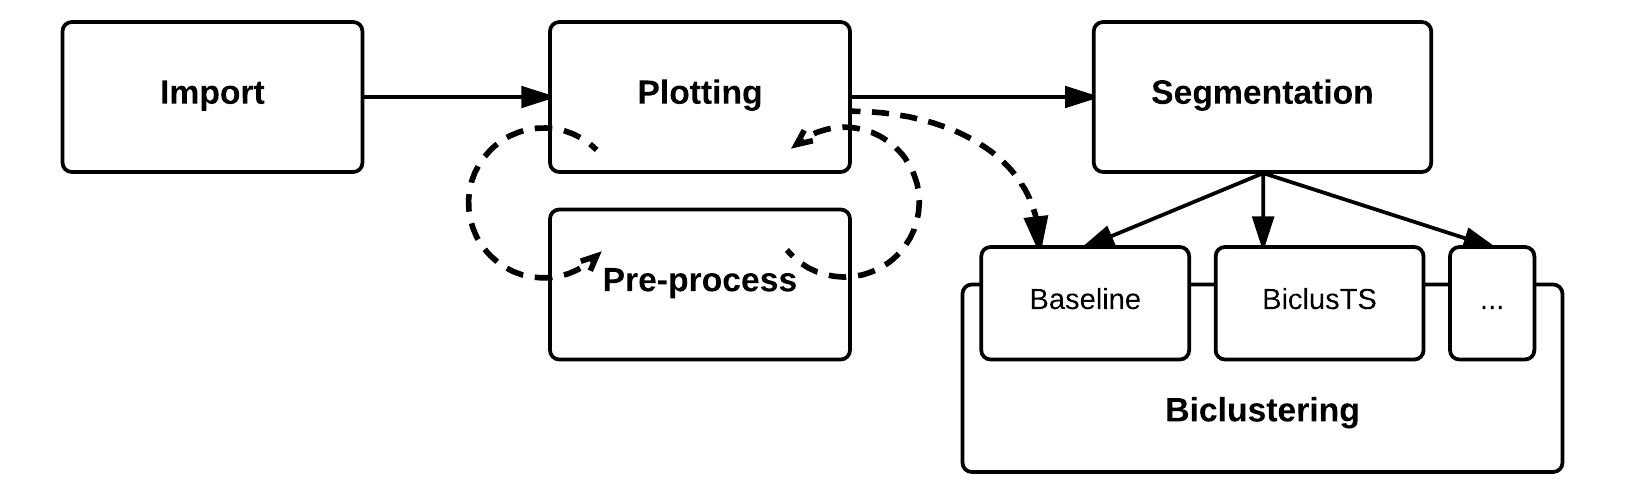
Large amounts of multivariate time series data are being generated every day. Understanding this data and finding patterns in it is a contemporary task. To find prominent patterns present in multivariate time series, one can use biclustering, that is looking for patterns both in subsets of variables that show coherent behavior and in a number of time periods. For this, an experimental tool is needed.
Here, we present Bipeline, a web-based visualization tool that provides both experts and non-experts with a pipeline for experimenting with multivariate time series biclustering. With Bipeline, it is straightforward to save experiments and try different biclustering algorithms, enabling users to intuitively go from pre-processing to visual analysis of biclusters.
Users could upload dataset and view details with a data table and summary info, e.g. Min. Max. and Mean.
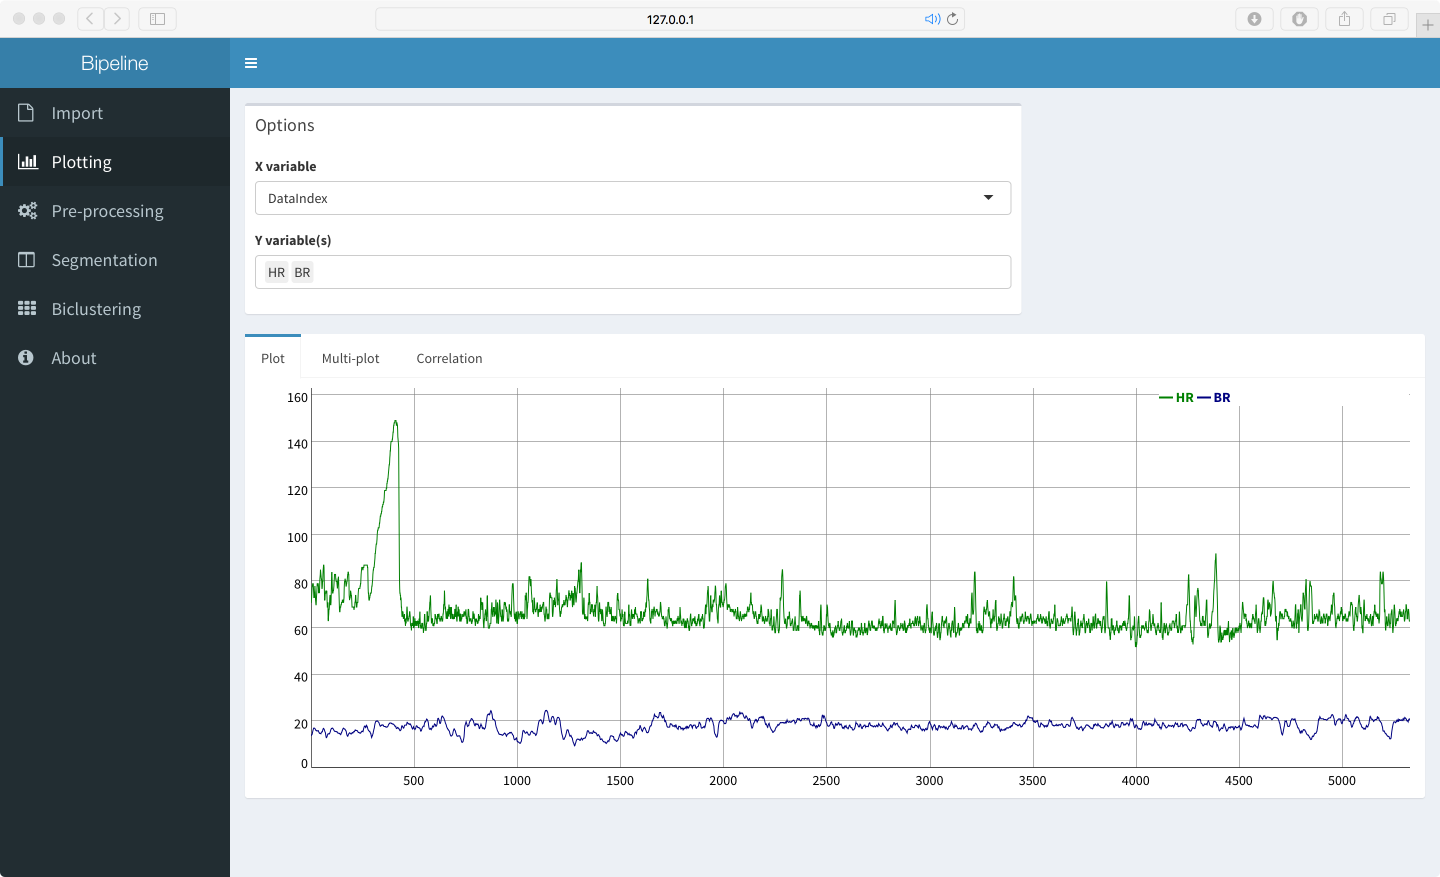
It's often of high importance to have a visual inspection of the raw time series first before digging into details. Plotting panel includes plotting, multi-plotting and correlation tab.
An interactive plotting R package dygraphs dygraphs is implemented instead of traditional static image plotting, which allows part of time series to be selected for zooming in. Zoom in/out functionality is one of the most desired characteristics of visual inspection tools for large time series dataset.
In multi-plotting tab, each of selected variables is plotted in an individual dygraphs plot, and zoom in/out of any of them will be synchronized across all plots. Correlation tab uses simple linear regression to plot a fit line for selected X and Y variables.
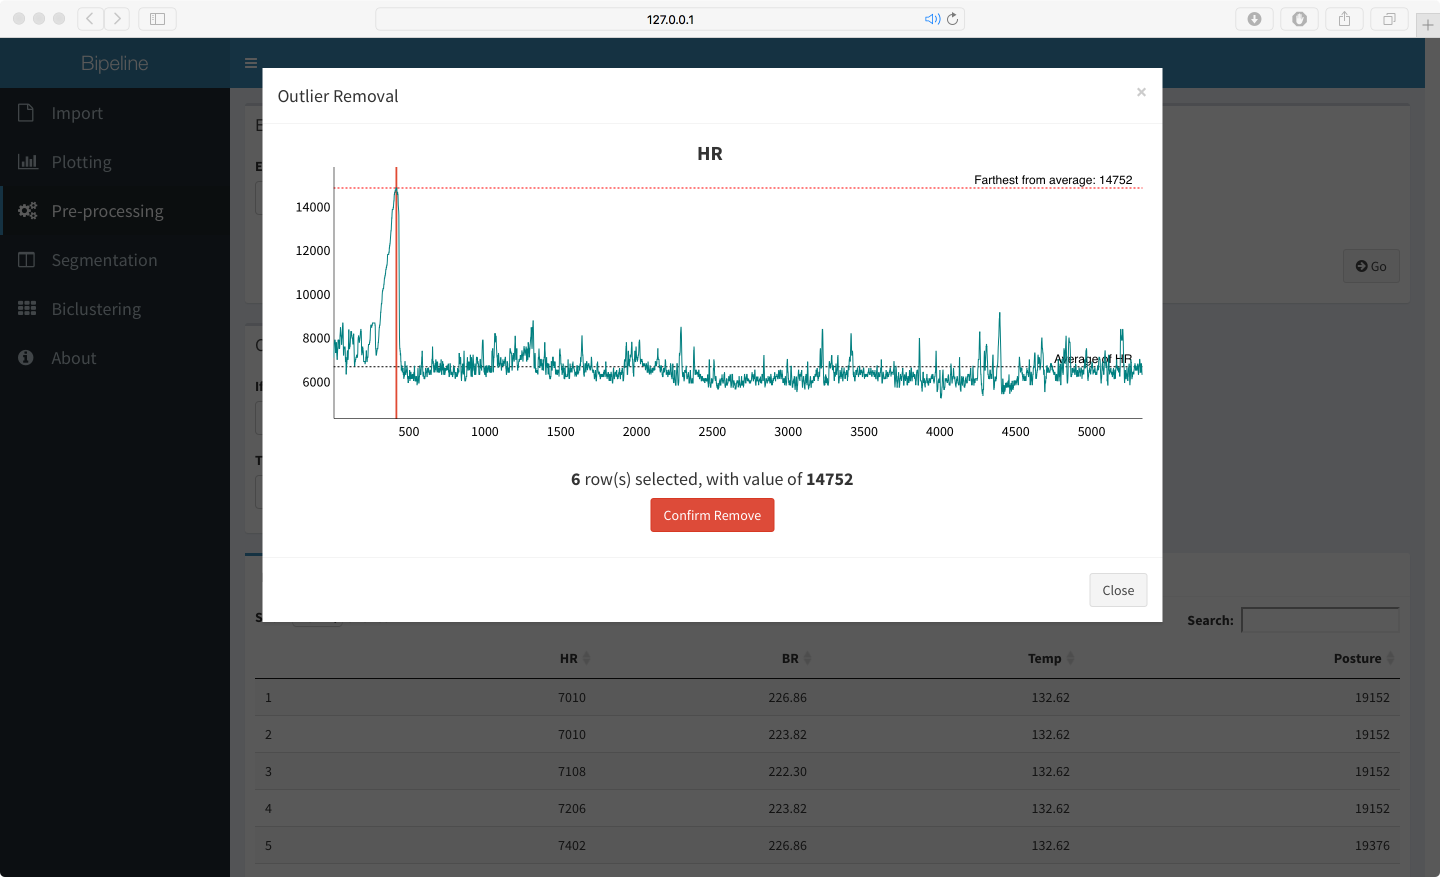
Raw data often requires error handling such as:
Exclude variables;Normalization;Conditions: to remove or replace conditional data lines;Outlier Removalas shown above: selecting data points that are furthest away from the average, as candidates to be removed.
Users could execute iterative process of plotting <==> pre-processing until the data is ready, then export pre-processed data to local disks by clicking Save button, or continue moving to segementation and biclustering.
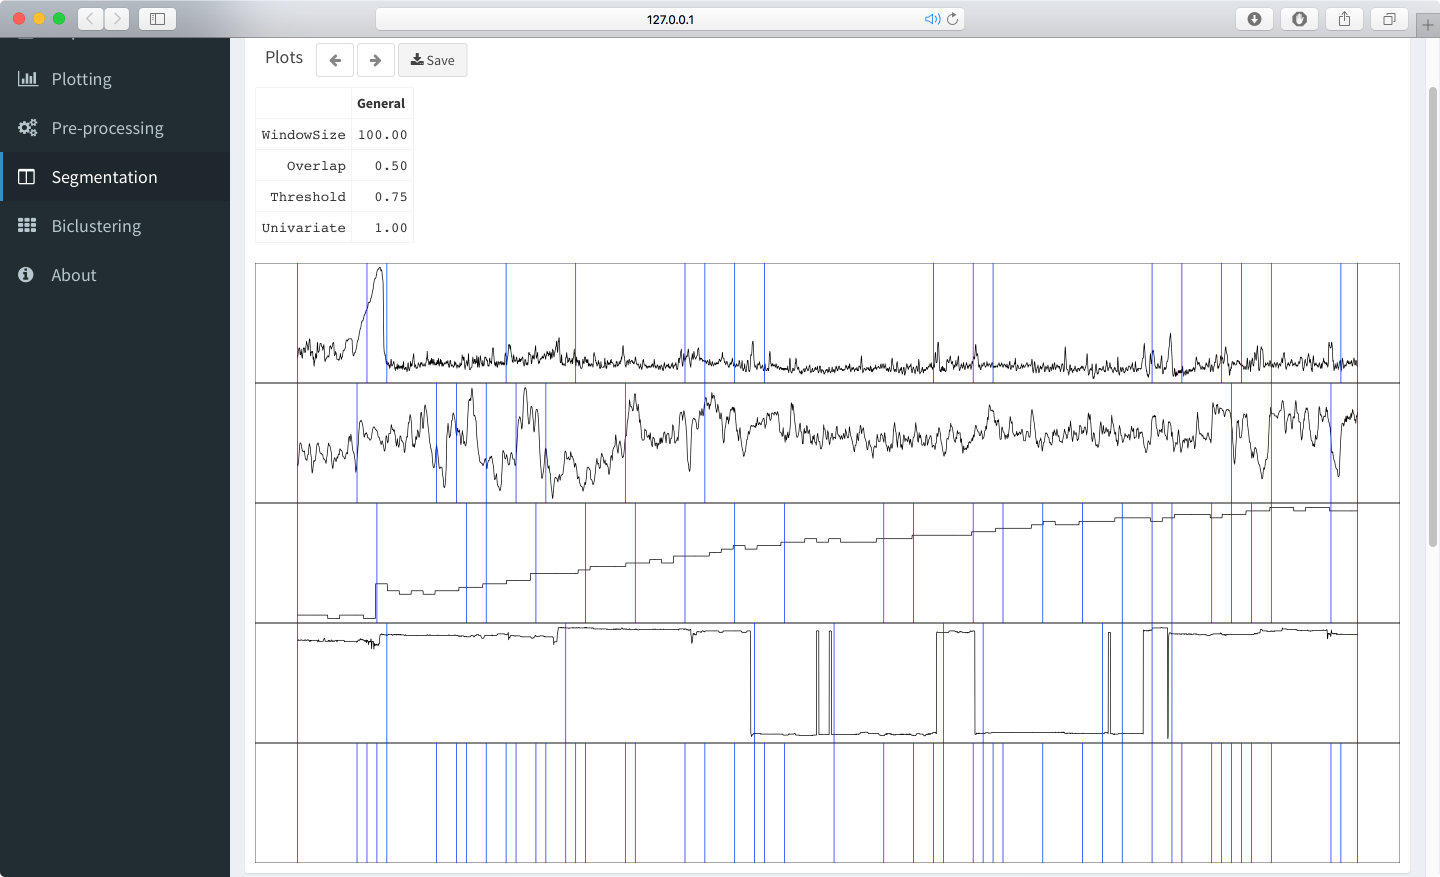
By default, all variables share the same setting of parameters in segmentation. By selecting the names of variables, control panel will update dynamically created tabs for users to set individual arguments, which offers great flexibility. Window Size, overlap, threshold and variate type could be easily tuned with clicks and drags.
The minimum segment size is customizable, and the tool will merge short segments in the union of segmentation boundaries by comparing similarities between siblings.
Segmentation results could be saved & loaded, which is useful when users have finished segmentation step and they can directly jump to biclustering step by loading previous saved segmentation files. These results will be used in the following biclustering step by default, however, user could disable that in baseline biclustering methods by unchecking corresponding option.
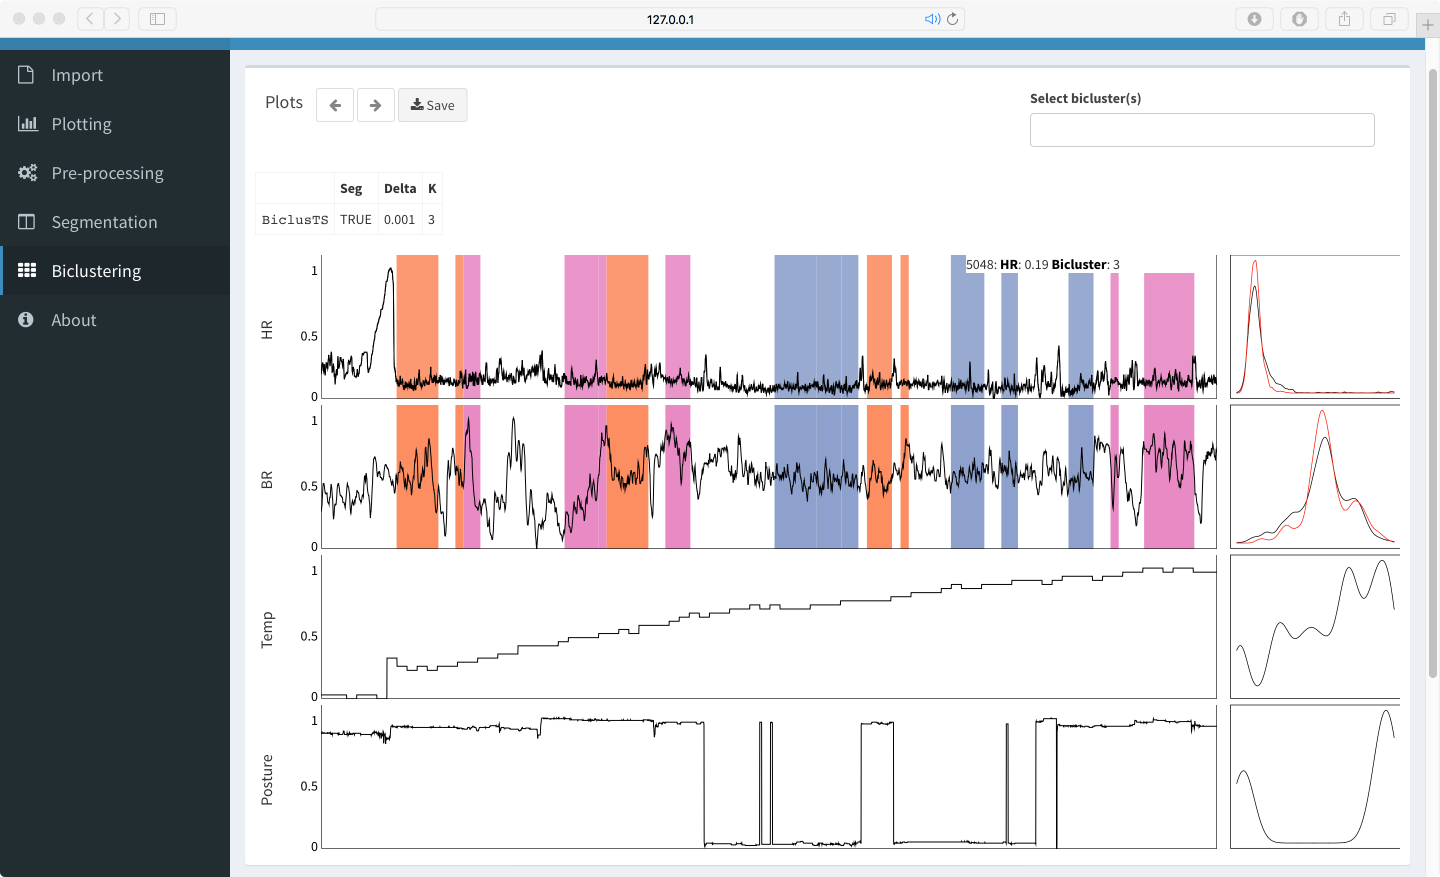
A number of biclustering algorithms are intergrated:
Baseline: Extensible R biclust methods, e.g. BCCC.Segmentation + Baseline: Use segmentation results to generate biclusters. Baseline biclustering has a very fast calculation speed. But this method has problem of capturing distributions.Segmentation + BiclusTS: A novel algorithm BiclusTS is introduced to overcome above problem, which captures similarity by differences in the distribution within each segment by means of LSDD.
All biclusters are plotted in coloring blocks, as shown above. Users could filter bicluster names in a multi-select menu, and the plot will respond with realtime update.
Density distributions are at the right side of plots, in which red curves stand for selected biclusters and black for all data points.
- Plots and parameters throughout all experiments will be kept in history. And hence users could navigate backwards and forwards for optimization of parameters.
- A progress bar showing current progress percent will appear when backend server is busy carrying out calculation.
- A screenshot of interactive web components could be saved by one click. It is implemented with Javascript and Canvas technologies and thus does not require external server resources.