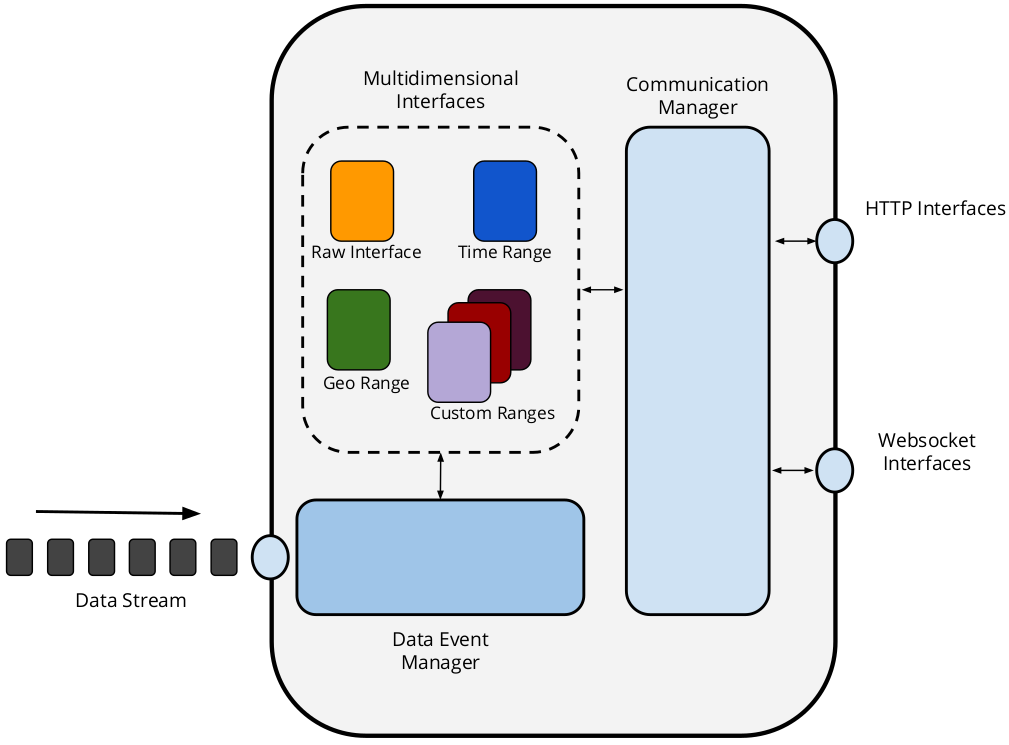
The Live Time Series Server is an ongoing implementation that aims on providing a cost efficient interface for Open Stream data publishing. Through an extensible modular architecture we allow data publishers to define multidimensional interfaces to provide query answering functionalities on top of their data.
Features:
- Allows to define custom interfaces to publish pre-processed summaries of the data.
- Modular and extensible architecture for implementig new features.
- Keeps and publishes history over HTTP using appropriate caching headers.
- Can expose HTTP and Websocket interfaces for communication with clients.
A more detailed description can be found on this demo paper.
A RDF stream object is a named graph with elements as follows:
<a> <b> <c> <graph1> .
<...> <...> <...> <graph1> .
<graph1> prov:generatedAtTime "2018-..." .
As an example we provide a set of around one hour of parking availability observations (made every 30 seconds) for the city of Ghent. The examples and implementations we describe next are based on this example data.
Clone this repository and run npm install to install all necessary modules.
An example configuration file (config.json)
is provided. This file defines the main communication parameters of the server and as an example, also defines 3 different
multidimensional interfaces (RawData, StatisticalAverage and GeographicClassification). The main parameters are:
{
  "serverUrl": "http://localhost:8080/", // Web server main URL.
  "httpPort": 8080, // Web server access port.
  "interfaces": [...] // Multidimensional interfaces specification.
}This is the default interface for the server as it takes the received stream updates and exposes them without any modification.
This interface allows also to store historic data as Linked Data fragments. For this example
the data is exposed through HTTP using /RawData/latest URL for the most updated data and /RawData/fragments{?time} URL
to access historic data. It also exposes an optional Websocket interface to push the latest updates to subscribed clients.
Each interface can define its configuration parameters according to their needs. for this specific implementation these are
the defined parameters:
{
  "name": "RawData", // Interface name. Used to define the HTTP URLs.
  "path": "../lib/interface/RawData", // Path to the interface javascript implementation. Used to dynamic module loading.
  "websocket": true, // Determines if a Websocket interface will be exposed.
  "wsPort": 3001, // Port for Websocket interface.
  "fragmentsPath": "./example/data/RawData", // Path to the folder where the historic data will be stored.
  "staticTriples": "./example/data/rawdata_static.trig", // Static triples to be aggregated to the data stream.
  "maxFileSize": 100000 // Maximun size in Bytes of each historic data fragment.
}This interface serves as an example of exposing precalculated values from the original data of the stream. On this concrete implementation we expose the arithmetic mean of the parking availability of each defined parking lot in the stream. The data can be accesed on different levels that follow a time-based dimension (i.e. year, month, day and hour). Each time a new data update is received, the servers proceeds to re-calculate the arithmetic mean values and updates them on each level. The server also adds metadata using the Hydra and Multidimensional Interface vocabularies to link the different levels together. Next there is a snippet example of the data that can be retrieved at a month level using the TriG format:
<http://localhost:8080/StatisticalAverage/fragment/2018_2019/02_03> {
<https://stad.gent/id/parking/P7> ts:mean "348".
<https://stad.gent/id/parking/P10> ts:mean "635".
<https://stad.gent/id/parking/P1> ts:mean "502".
<https://stad.gent/id/parking/P4> ts:mean "411".
<https://stad.gent/id/parking/P8> ts:mean "125".
<https://stad.gent/id/parking/P2> ts:mean "390"
}
<http://localhost:8080/StatisticalAverage/fragment/2018_2019/02_03> <http://www.w3.org/ns/prov#generatedAtTime> "2018-02-28T23:58:20.813Z";
    a mdi:RangeFragment;
    mdi:initial "2018-03-01T00:00:00.000Z";
    mdi:final "2018-04-01T00:00:00.000Z";
    mdi:hasRangeGate <http://localhost:8080/StatisticalAverage/fragment/2018_2019/>;
    ts:sampleSize "126";
    a mdi:RangeGate;
    hydra:search <http://localhost:8080/StatisticalAverage/fragment/2018_2019/03_04#search>.
<http://localhost:8080/StatisticalAverage/fragment/2018_2019/03_04#search> hydra:template "http://localhost:8080/StatisticalAverage/fragment/2018_2019/03_04/{+initial_final}";
    hydra:mapping "http://localhost:8080/StatisticalAverage/fragment/2018_2019/03_04#mapping".
<http://localhost:8080/StatisticalAverage/fragment/2018_2019/03_04#mapping> hydra:variable "initial", "final";
    hydra:property mdi:initial, mdi:final.
Not implemented yet.
To test the server a RDF stream can be piped into the server. We can pipe the example dataset into the server using the replay-timeseries tool, which allows to control the frequency of the updates. Follow the next steps to test the server after installation:
$ cd timeseries-server
$ npm install -g replay-timeseries
$ cat parking_data.trig | replay-timeseries -s 10x | node bin/timeseries-server.js -c config.json
As the original observations were made every 30 seconds, we use replay-timeseries -s 10x to replay them every 3 seconds
(10 times faster). This tool also rewrites the prov:generatedAtTime value to the current time for testing purposes.
To access the data you can use a polling approach through HTTP as follows:
$ curl http://localhost:8080/RawData/latest # Will return the latest stream update.
$ curl -L http://localhost:8080/RawData/fragments # Will redirect to the most recent data fragment.
$ curl -L http://localhost:8080/RawData/fragments?time=2018-03-20T10:15:00.000Z # Will redirect to the fragment containing observations starting on the given time
Each fragment contains Hydra metadata to link to previous data fragment.
Please take into account that the data starts to be calculated from the moment the server is initialized, therefore the dates defined in the test URLs showed next have to be adapted to the moment you run the server.
$ curl http://localhost:8080/StatisticalAverage/fragment/2018_2019 # Will return the available calculated averages for the year 2018.
$ curl http://localhost:8080/StatisticalAverage/fragment/2018_2019/03_04 # Will return the available calculated averages for the month 2018/03.
$ curl http://localhost:8080/StatisticalAverage/fragment/2018_2019/03_04/25_26 # Will return the available calculated averages for the day 2018/03/25.
$ curl http://localhost:8080/StatisticalAverage/fragment/2018_2019/03_04/25_26/15_16 # Will return the available calculated averages for the hour 2018/03/25 15:00.
Each level contains Hydra metadata to link to the upper level and also defines how to query the next available inferior level.
To access the data through Websockets you can execute the example Websocket client provided on this implementation as follows:
$ cd timeseries-server
$ node lib/WebSocketClient.js
It subscribes to both the Websocket channels defined by the RawInterface and the StatisticalAverage interface. It will print on console the data it receives from the server.
We plan to extend this implementation with the following features:
- Mapping capabilities to work with non-RDF streams.
- Support for Server-Sent Events interfaces.
- A mechanism to weigh Multidimensional Interfaces and determine their cost (cpu, memory, response time, etc) on the server.
- A benchmark evaluation on the different types of communication interfaces to determine the most suitable one for a given data stream.
Julian Rojas - [email protected]
Pieter Colpaert - [email protected]