A few months after buying my first manual transmission vehicle (a 2007 Saab 9-3 Aero), I was having a lot of fun with it but found myself with a problem I wanted to solve. In doing so I ended up learning a lot about CAN-networking, Raspberry Pi, and bluetooth communication.
Occasionally while driving I would find myself wondering what gear I was in, especially if I hadn't recently changed gears. Yes, I could just remember. Yes, I could compare RPMs to vehicle speed in my head. Yes, I could look at the shifter and try to tell whether it was in 4th, or slightly to the right in 6th. But none of those solutions would let me tinker with my big boy toys.
So I set out to install a screen in my car that would show me what gear I am in. In each gear (1-6), when the gear is engaged there is a constant and unique ratio of engine RPM to vehicle speed (occasionally the ratio changes slightly due to a few factors but 99% of the time it will be consistent). By accessing the OBDII port, I can probably get instantaneous readings for the engine RPM and for the vehicle speed, so once I build everything I should be able to instantaneously estimate what gear I'm in. Since I need RPMs as part of the calculation for gear, I'll go ahead and throw in a digital tachometer to fill up the screen and make it look cooler.
Raspberry Pi 3
3.5 inch Touch Screen with Case
Power Cable
Arduino Uno
seeed CAN Shield
DB9-to-OBDII cable
I did a lot of things in order to get this thing done. I'll try to recount them chronologically.
Below is the what the information panel looks like on the car before modification. It's pretty basic - tachometer on the left, spedometer in the middle, some other gauges on the right, text display on the bottom, and some indicator lights throughout.

The first thing I did was take a detailed picture of the tachometer, and trace it in Inkscape. Now I had a digital copy of the background of the gauge, as well as a digital copy of the needle. I applied a little styling, saved them both as separate files, then used the pygame module in python to draw them when I ran my Python script. I also wrote some code for rotating the needle based on an RPM value. The result is below.

This step was pretty simple. I was running Raspbian on the Pi, so all I had to do was clone my private git repository. After doing that I had the file on the Pi. Next I had to set up the Touch Screen and Case. After applying some elbow grease, I now had the Raspberry Pi inside the case, connected to the screen. I connected a wireless USB keyboard+mouse combo that I used for most of my in-vehicle development.
Physically, the connection here goes:
OBDII port near brake pedal -> ODBII-to-DB9 cable -> CAN shield -> Arduino -> USB cable -> Raspberry Pi
The setup was kind of messy at this point, but I had what I needed to start messing around with the vehicle. I implemented a basic CAN reader program using the MCP_CAN library. The program will monitor the OBDII port, and whenever it sees a CAN message, package it into a string and send that over a serial connection to the Raspberry Pi. I then wrote some code on the Raspberry Pi to watch for those packages and write them to a text file that I could review later.
CAN messages are composed of a message identifier followed by some number of bytes of data (this is a simplification, but that's all you need to care about most of the time). So after running the setup from step 3 in-vehicle, I get a text file with a bunch of lines in it, and each line has a 3 digit number followed by some bytes in hex. The bytes contain information that the car's modules are passing to one another - a powertrain module might put a message on the bus that contains the coolant temperature in the first 4 bytes and engine RPM in the next 4 for example.
However, for some mostly good reasons, automotive OEMs don't tell the public what each message means, how to decode it, units, or anything. So if you're DIYing it, you have to figure it out yourself unless someone else has already done so (shout out to commaai/opendbc, who have compiled a lot of that information for a variety of vehicles, but not for my Saab).
The information I'm interested in for this project is engine RPM and vehicle speed, but while I had everything set up I figured I would map as much of the bus as I could in case I want something else in the future or if someone else does. To start I wrote out a test procedure and started taking data. Each of the maneuvers was attempting to isolate certain vehicle behaviors, and involved things like turning the steering wheel while at standstill, accelerating in a straight line, and pulling and releasing the park brake. Because I followed my procedure in order and on time, I was able to compare the CAN data with what I knew I was doing at a given time to learn more about what messages reacted to my behaviors.
To make comparison easier, I made a GUI in python to help me rapidly review results. Basically the script would load a text file of CAN data, and then separate the messages so that those with the same message identifier were grouped together. It asks the user to select a message identifier, and a single byte or pair of bytes to review. It then plots the selected submessage data over time, at which point I reviewed each.

A lot of the reviewing was easy - many of the plots were meaningless noise, which would only make sense when viewed in a different way or combined with other bits. In others, I saw trends that resembled physical quantities - what looked like a speed profile, or a steering profile, or a brake pedal profile. I lucked out in that I was interpreting the bits in Big-Endian and got meaningful data. The messages could have been Little-Endian instead, in which case I would have had to interpret them the opposite direction, but they weren't, so I didn't. After some more experimentation, I arrived at a fairly sparse map of the 2007 Saab 9-3 CAN bus map. I didn't completely finish that - there are some signals I couldn't decode or figure out what they were, but I got what I needed and more. Among other reasons, some submessages remain uncharted likely because they start or end in the middle of one of the bytes, or are composed of more than 2 bytes.

What I found was that engine RPM seemed to match 0x110 bytes 2 and 3, multiplied by 4. I also found that vehicle speed seemed to match pairs of bytes in 0x280, divided by 5 (probably each pair is one corner of the car). That was enough to move on to the next task.
In order to detect what gear I am in at any point in time, I needed to find what each gear 'looks like' in terms of engine speed per vehicle speed. I ran the datalogging scripts for a few days, and then reviewed the data. I ended up with 6 distinct ratios, which I then hardcoded into my future scripts. I implemented logic that calculates the current ratio of engine speed per vehicle speed, and then finds the closest gear to that value.
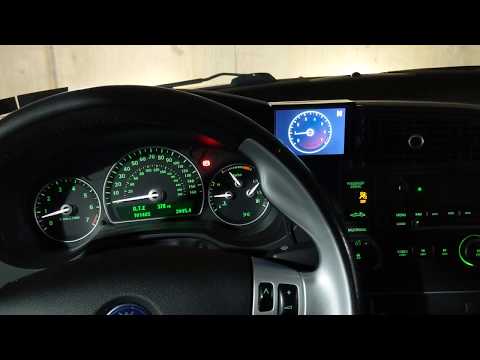
Now I had everything I needed. I modified the arduino code so that it only passed messages 0x110 and 0x280 to the Raspberry Pi, and set up the python script to parse the messages and display the current RPM and estimated gear. Everything worked pretty well at this stage, but I had a lot of cords, so I wanted to see what I could do about that. Code is here. Click on the image below for a short video showing the setup at this point.

At a minimum I knew I needed the Raspberry Pi, power to the Raspberry Pi, and some sort of connection to the OBDII port. I looked into OBDII shields and adapters for the Raspberry Pi, but they all were either too expensive or wouldn't fit with the packaging constraint of the enclosed LCD screen. I decided to try a cheap bluetooth OBDII reader from Amazon, which I figured should work since Raspberry Pi 3s have bluetooth compatibility out of the box. The only connections in my new system would be (1) 12V cigarette lighter power to Raspberry Pi, (2) Bluetooth code reader to OBDII port. I spent quite a while diving into setting up the bluetooth communication to the Raspberry Pi, and ultimately was able to get similar results to when the Arduino was in the loop... for a few seconds at a time.
There are 2 main types of things that you can read through an OBDII port:
- CAN messages being sent between ECUs within the vehicle, which would be there whether you were plugged in or not
- CAN messages that are a response to your tool. In other words, you send a command through the port asking for some information, and the information returns to you as a response. Wikipedia provides a pretty good overview on some of these.
With the arduino, I was reading the first type of message. When I tried to do the same with the bluetooth reader, it would work for a few seconds but then tell me that the buffer overflowed and no more data could be read. I tried messing with filters, continuous resetting of the connection, and a few other things, but none of it allowed me to get a steady and stable stream of data like I had with the Arduino. It appeared to be a limitation of the bluetooth protocol - data would start piling up on the bluetooth reader faster than it could transmit to the Raspberry Pi. If the messages I was interested in were coming in at a slower rate, I might have been able to get this to work, but they weren't, so I couldn't. So I started playing with the second type of message (query-and-response).
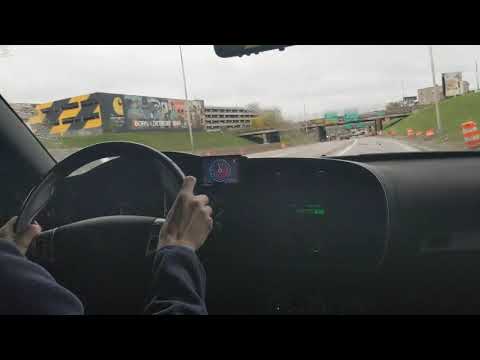
I identified the standard PIDs and scalings for engine speed and vehicle speed and wrote some code to rapidly query the bluetooth reader for both, and read its responses. If I asked for the information too often, it would fail to send the responses in time, so I had to settle on a compromise of speed and stability. In the end this method ended up being a little bit choppier than the original, but works just as well and has successfully been telling me what gear I'm in for a few months now. Code is here. Click the images below for a couple short demo videos.
I had a lot of fun working on this and hope someone finds it interesting and maybe even useful!
-Wifi-direct connection instead of bluetooth to increase data rate and defeat buffer overflows.
-Hijack text-display on Saab panel to display the gear.
-Display other interesting things.
-Incorporate into custom Android Auto Raspberry Pi software