Easily visualize point cloud data (e.g from LIDAR). Based on lidar-visualizations.
Video: https://www.youtube.com/watch?v=MQhYTqz40xI
Indoor – walking around the house:
Outdoor near street – passing cars can be seen:
Outdoor – lots of trees and shrubs around:

-
Install SFML:
$ ./install_sfml -
Build:
$ make -
Run:
$ ./lidar-vis -
Install (Optional):
$ make install
You will probably encounter an error looking like this:
dyld: Library not loaded: @rpath/libsfml-graphics.2.5.dylib
  Referenced from: /Users/bartek/dev/cpp/lidar-vis/./lidar-vis
  Reason: image not found
[1]    45637 done       cat datasets/series/from_stream.txt |
       45638 abort      ./lidar-vis -s
To fix this, set LD_LIBRARY_PATH environment variable (of course, change the path accordingly):
$ export LD_LIBRARY_PATH=/Users/bartek/dev/cpp/lidar-vis/sfml/lib
If you're on macOS and getting an error similar, but a bit different to the one shown above, check out this StackOverflow thread.
The Visual Studio solution file is placed in vs directory. SFML is required. More detailed description can be found in lidar-visualizations repository.
After successful compilation and linking, you will have a lidar-vis executable.
You can control its behavior by passing command-line flags.
For example, to visualize a single cloud scan:
$ cat cloud.txt | lidar-vis
To visualize only the first 200 points of a single cloud scan:
$ head -n 30 cloud.txt | lidar-vis
To visualize a cloud series scan:
$ cat cloud_series.txt | lidar-vis --series
To learn more about all available options and keyboard shortcuts:
$ lidar-vis --help
General:
-h  --help                     Display help
-o  --output-dir [dirname]     Output dir
-s  --scenario [id]            Specify scenario (default: 0)
-g  --gui [id]                 Specity GUI (default: 1)
SFML GUI options
-H  --height [val]              Window height (defualt: 1280)
-W  --width [val]               Window width (defualt: 720)
-C  --colormap [id]             Colormap (0, 1)
-M  --ptr-mode [id]             Points display mode (0, 1, 2)
-B  --bold                      Larger points
-S  --scale [scale]             Scale (1mm -> 1px for scale = 1.0)
Scenarios are sets of actions which are executed just after grabbing the cloud data, and just before its visualization by the GUI.
0    Do nothing, just grab a cloud and visualize (default).
2    Save each cloud as a new screenshot (extremely unoptimized).
GUI is responsible for the visual layer of the application and interacting with the user.
SFML GUI Keyboard shortcuts:
T                 Save cloud to .txt file
S                 Save screenshot
Arrows            Move cloud
Moude scroll      Scale cloud
Mouse middle      Reset position, autoscale cloud
C                 Switch colormap
M                 Switch points display mode
Files contain data of a single point cloud (e.g. a full 360° scan, combined scan). Each
line (except for comments which must start with #) represents a single point which
consists of an angle value [°] and a distance value [mm]. Both may be a floating
point number, and have to be separated by any kind of white characters.
Example:
# A comment
# Angle [°]   Distance [mm]
90.0    42.0
180.0   1000
270.0   1920.11
360.0   2002.0
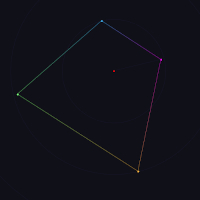
Preview:
lidar -f datasets/example.txt
Files contain a list of point clouds. This variant can be used to record a series of captured
clouds. The rules are the same as in the previous paragraph, but there are some special lines
starting with ! which separates two point clouds. Each line marked with ! should consist
of the ID number of the following point cloud and number of milliseconds elapsed from
@grabbing the previous one. Clouds should be sorted by their ID number.
Example:
# A comment
# ! ID Number   Elapsed time [ms]
# Angle [°]   Distance [mm]
! 0 0
120  100
240  100
360  100
! 1 500
120  200
240  200
360  200
! 2 500
120  300
240  300
360  300
! 3 500
Preview:
lidar -fs datasets/example-series.txt