wifi-heatmapper displays heat maps of both Wi-Fi signal strength and the results of network throughput (speed) tests. Use it to find out if your wi-fi signal is actually weak, or if there is something else wrong with your network. If there is a signal-strength problem, you can use the heat map to optimize access point placement, or to add new mesh devices or extenders.

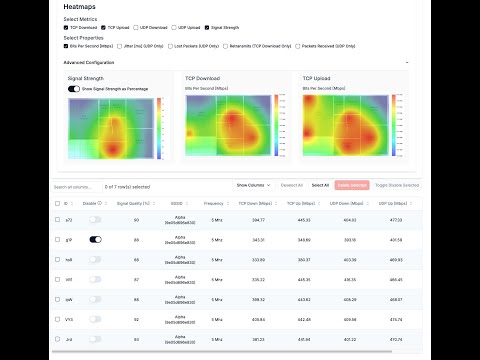
The heat maps use a green color ("green is good") to show areas of strong signal (or high data transfer speeds). Signal levels fade to turquoise, then to blue (lowest acceptable). Yellow and red colors indicate poor signal levels.
The screen shot above is a sample heat map. It was created by measuring about two dozen points around the house, especially locations where people actually use a computer. The heat map shows that the signal levels throughout the house are acceptable — mostly green, turquoise, and blue. The areas of yellow or red are at the edges, or on a stairway where no measurement was taken (the large yellow area in the middle). (Don't have a floor plan for your home? See the FAQ.)
wifi-heatmapper runs on Windows, macOS, and Linux. There are more details about the operation at:
-
Install wifi-heatmapper. You'll want it installed on a laptop so you can move it around and measure signal strength at various locations. See Installing and Running below for details. Then browse to http://localhost:3000.
-
Settings pane: To get started, use the default floor plan (EmptyFloorPlan.png) and provide a sudo password for macOS or Linux. Leave the other settings at their default. No throughput tests are made when the iperf3 server is set to "localhost".
-
Switch to the Floor Plan tab. You'll see the built-in Empty Floor Plan or your uploaded image.
-
Start a measurement by clicking the floor plan at a point that reflects your laptop's location. wifi-heatmapper measures the WiFi signal strength and (optionally) the throughput at that point. When the measurement is complete, the floor plan displays a dot colored by its signal stength. Click the dot to get more information.
-
Move to other locations and make further measurements. Make at least one measurement per room. Multiple measurements per room provide more fine-grained data.
-
Click the Heatmap tab to see the resulting heat map. Areas with strong signal will be green, lower signal levels will follow the Green -> Tuquoise -> Blue -> Yellow -> Red transition. Adjust the Radius slider until the spots grow together. Go back to the Floor Plan tab to make more measurements if needed.
-
Click the Survey Points tab to see all the survey points, with details of the measurements taken. Remove errant points using this tab.
wifi-heatmapper requires a recent Javascript environment (tested on Node 23). Install it on a laptop device so you can move from place to place. To install the software:
-
Pull the repo, install the
npmdependencies, and run the project. To do this, run these commands from a terminal:git clone https://github.com/hnykda/wifi-heatmapper.git cd wifi-heatmapper npm install npm run dev -
Browse to http://localhost:3000 and follow the steps at the top of this page
Note: Installing the iperf3 client and server are optional.
This makes the initial installation straightforward:
simply perform the two steps above.
But you miss out on the ability to make throughput tests.
To take advantage of iperf3 throughput (speed) tests:
- Install
iperf3on your laptop. Follow instructions on the internet for your OS. Note: there are other speed tests with a name likeiperf...They are similar, but incompatible. Be sure to installiperf3 - Install
iperf3on another computer. This will be the "iperf3 server". This could be a desktop or another laptop, or even a Raspberry Pi 4 or 5. - Start the "iperf3 server" on the other computer with
iperf3 -s - Optional checks: Run these tests on the laptop:
- Check the local iperf3 binary with
iperf3 --version - Check the connection to the iperf3 server
with
iperf3 -c address-of-iperf3-server
- Check the local iperf3 binary with
WiFi Heatmapper includes a Dockerfile that automates much of the installation process for Linux. NB: The Dockerfile does not work on macOS or Windows. See the note in the Dockerfile for more information.
-
Build the Docker Image
docker build -t wifi-heatmapper . -
Run the Container
docker run \
--net="host" \
--privileged \
-p 3000:3000 \
-v ./datas/data:/app/data \
-v ./datas/media:/app/public/media \
wifi-heatmapper
use -v options if you want to save db + floorplanpicture to the datas folder
This project is a WiFi heatmapper solution for macOS/Windows/Linux, inspired by python-wifi-survey-heatmap. @hnykda wanted to create a heatmap of his WiFi coverage, but the original project didn't work because he is running on Mac. He also wanted something that might be slightly easier to use, i.e. using a browser. @richb-hanover refactored the GUI to its current four-tab appearance.
This is a video recording of an earlier version of wifi-heatmapper.
The basic operation is the same, but looks different now.
In this version, all the user interface was in one page,
and it used a different color scheme:
red indicates "hot" (strong signal),
blue was "cool" (weak).
This project was inspired by python-wifi-survey-heatmap. Special thanks to the original author for their work.
Feel free to contribute to this project by opening an issue or submitting a pull request. I am more than happy for that!