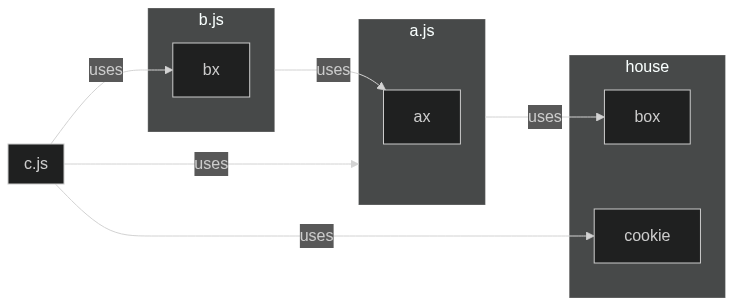
This is a cli tool that tends to visualize a codebase right from inter-file to
in-file dependency so you can understand how it is developed. It is basically
based on the fact that every programming language has known standard approaches
to handling modules/packages; imports and exports. Unlike existing dependency
resolution/visualization tools that are language-specific or parser-centric,
depgraph is language agnostic since it uses regular expressions to match import
and export statements from which a dependency graph is constructed. While this
is experimental, it produces amazing results for small vanilla projects. The
graph is formatted and output as json, jsoncanvas, or
mermaid.
Warning
depgraph is experimental and incomplete. It is under active development.
I landed onto a codebase and couldn't figure out what was going on fast; have you ever experienced that before? It is overwhelmingly a rewarding process that takes me many hours trying to figure out lots of stuff in a new codebasee. So, I wanted to speed up the process a little bit such that I can easily fix a bug/issue or contribute to any project seamlessly. Additionally, I needed to learn ideas and patterns from several amazing opensource projects visually. Big codebases can scare, but not anymore, depgraph is here!
- cli
- export dependency graphs as formatted text
- json
- jsoncanvas
- mermaid
- dot
- multi-language support - work in progress
- js, ts - almost done
- c, cpp - in progress
- go
- python
- php
- ....
- interactive web interface (maybe d3.js or cyptoscape.js)
- generating images from the graph (like png, svg)
... and more to come
-
Using a shell script: Linux/Mac/Termux/WSL
curl -fsSL https://raw.githubusercontent.com/henryhale/depgraph/master/scripts/install.sh | bash -
Prebuilt Executables:
Go to the Github releases page and download a prebuilt executable for your platform/machine.
Usage: depgraph [options]

Options:
    -d directory
        Specifies the target directory to analyze (default: current working directory).

    -f format
        The output format of the analysis: mermaid (default), dot, jsoncanvas, json

    -h, --help
        Show information about the command-line options and exit.

    -i directories
        A comma-separated list of directories to ignore for example: 'tests,dist,build'

    -l language
        The programming language of the files: js, ts, c, cpp

    -o file
        Write output to the selected file (default: stdout)

    -r paths
        A key:value  comma-separated list of paths to replace for example: '@:src,demo:src/demo'

-v Show the current version information and exit.- vanilla js project with tests, need mermaid visual
depgraph -d /path/to/folder -f mermaid -l js -i tests
- ts/js project with npm packages, tests, root directory alias (src -> @) and
json output
depgraph -d /path/to/folder -f json -l ts -i "tests,node_modules,dist" -r "@:src"
Note
In case you are working with a big codebase, you may consider taking small incremental steps by using depgraph to inspect/work on one subfolder at a time.
By default, the output is written to stdout. To save output to a file, you can
use;
-o <path>optiondepgraph -d /path/to/folder -l js -f json -o graph.json
- I/O redirection
depgraph -d /path/to/folder -l js -f json > graph.json
- mermaid - default: In case the output format is
mermaid, you can instantly use mermaid.live to view the output otherwise checkout this complete list. - dot: For a quick in-browser visualization & image export, check out:
Edotor,
GraphvizOnline,
Graphviz Visual Editor.
Otherwise Graphviz has a
command line utility to
generate images from the
dotoutput. - jsoncanvas: To view the visual output from
jsoncanvasoutput, use one of the apps on this list. - json: This option is meant from storage and usage with json viewer tools. While the search for a compatible and appropriate visualization tool for json output continues, this option may be removed in future releases.
This section describes how depgraph works when you run the command;
- Parsing CLI arguments: determine the target directory, output format, language and more
- Directory traversal: build a list of files, ignoring filtered paths
- Resolving dependencies: use regular expression to match imports and exports
- Building a dependency graph: transform files into nodes and edges from imports
- Formating the output: produce a stringified representation of the graph - json, jsoncanvas, mermaid
- Printing the results: output the result to standard output or file
Thank you for looking into this amazing project. Incase of any issues, bugs, or proposing a new feature: open a new issue.
To build this project locally, ensure that you have Go v1.23.2 installed.
Clone this repository using:
git clone https://github.com/henryhale/depgraph.git
At the root of the repository, there exists a shell script which when executed yields a binary executable; using your shell, run
bash scripts/build.shor
chmod +x scripts/build.sh
./scripts/build.sh© 2024-present Henry Hale.
Release under MIT License
