ISTIO Distributed Tracing Mission
| ID | Short Name |
|---|---|
|
|
| Group | Owner |
|---|---|
Security |
Georgios Andrianakis |
This mission showcases the interaction of Distributed Tracing capabilities of Istio and properly instrumented microservices running in the Service Mesh.
In a microservice topology, where an incoming HTTP call to the cluster / service-mesh could end up calling a host of other services, getting insights on the interactions of the individual services and performing debugging becomes complicated.
Distributed tracing gives developers and operators the ability to gain insights on the potentially complex interactions between microservices by painting a picture of what they look like in a graph form.
Istio facilitates the usage of Distributed Tracing by integrating seamlessly with Jaeger and Zipkin, but also places a small requirement / burden (being the propagation of special tracing related HTTP headers) on applications deployed in the Service Mesh in order to fully realize the benefits of Distributed Tracing.
-
Distributed Tracing
-
Istio
The applications deployed to the service-mesh need to be properly instrumented.
At the very least, instrumentation consists of propagating the proper HTTP headers when making requests between microservices. There are two options here:
-
Manual instrumentation where the developer of each service needs to take care to propagate the HTTP headers to all downstream calls
-
Use a library to automatically perform the instrumentation
The reason each application in the service-mesh needs to be instrumented for Distributed Tracing, is that in order to properly determine the relation between services (which service called which - or more formally what the nodes of the call DAG are), special metadata needs to propagated through each HTTP call, from the beginning of the life cycle of an incoming to request to the moment that the request is served to the external client.
Manual instrumentation has the advantage that no extra dependencies need to be packaged with the code in order to get proper instrumentation to work. However it places the burden passing the necessary HTTP headers squarely on the developers shoulders. This can potentially make the code that performs service to service HTTP calls look ugly while more importantly incurring a high probability of such manual instrumentation being forgotten when a developer implements it, or tracing-specific bugs being introduced.
Automatic instrumentation means that the developer need not worry about passing the necessary tracing HTTP headers in every service call, since the library that performs the instrumentation takes care of such operations. It does mean however that an extra library needs to be packaged with the application to have tracing working properly.
This booster showcases the second option, although utilizing the first one is only a matter of making some trivial changes to the booster code.
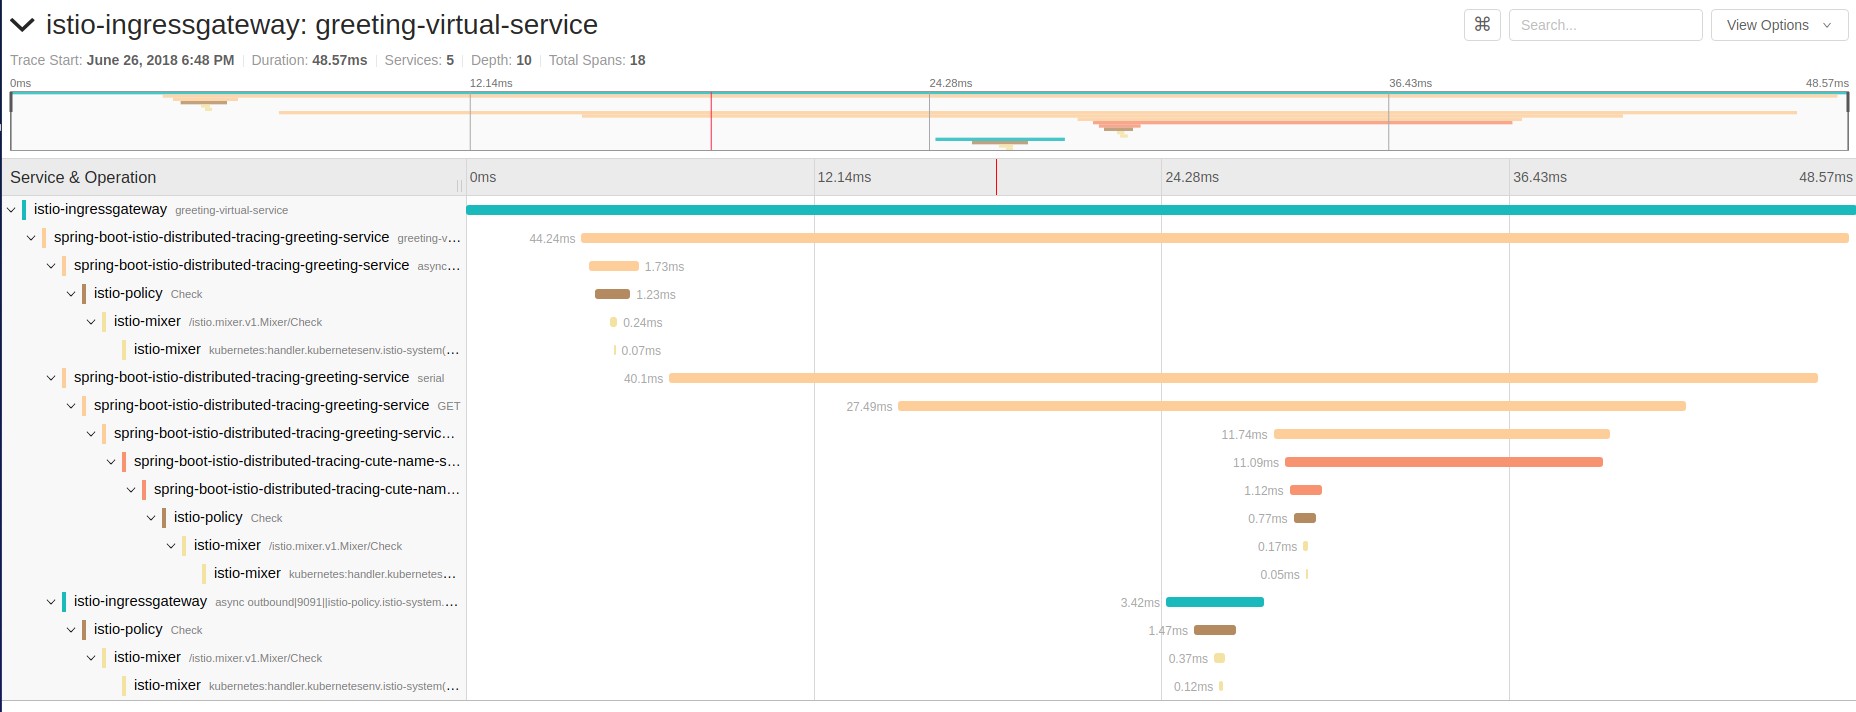
A dual-module application with a web page and a greeting service in one deployment and a cute-name service in another deployment.
cute-name service returns a random, name string.
Greeting service first gets a name from the cute-name service and then returns a greeting message string - "Hello, ${name}!".
Web page has a mission description, a button and a result field. The buttons trigger a REST call to the greeting which results in the result field being updated with result of the HTTP call.
-
The application is deployed via FMP or s2i (according to the README instructions)
-
User opens the web page. The URL to open can be obtained by executing the following
echo http://$(oc get route istio-ingress -o jsonpath='{.spec.host}{"\n"}' -n istio-system)/greeting -
User clicks on the Invoke button
-
The result of the HTTP call is displayed in the results field
-
User finds the traces resulting from the call (by following the instructions on the web page)