
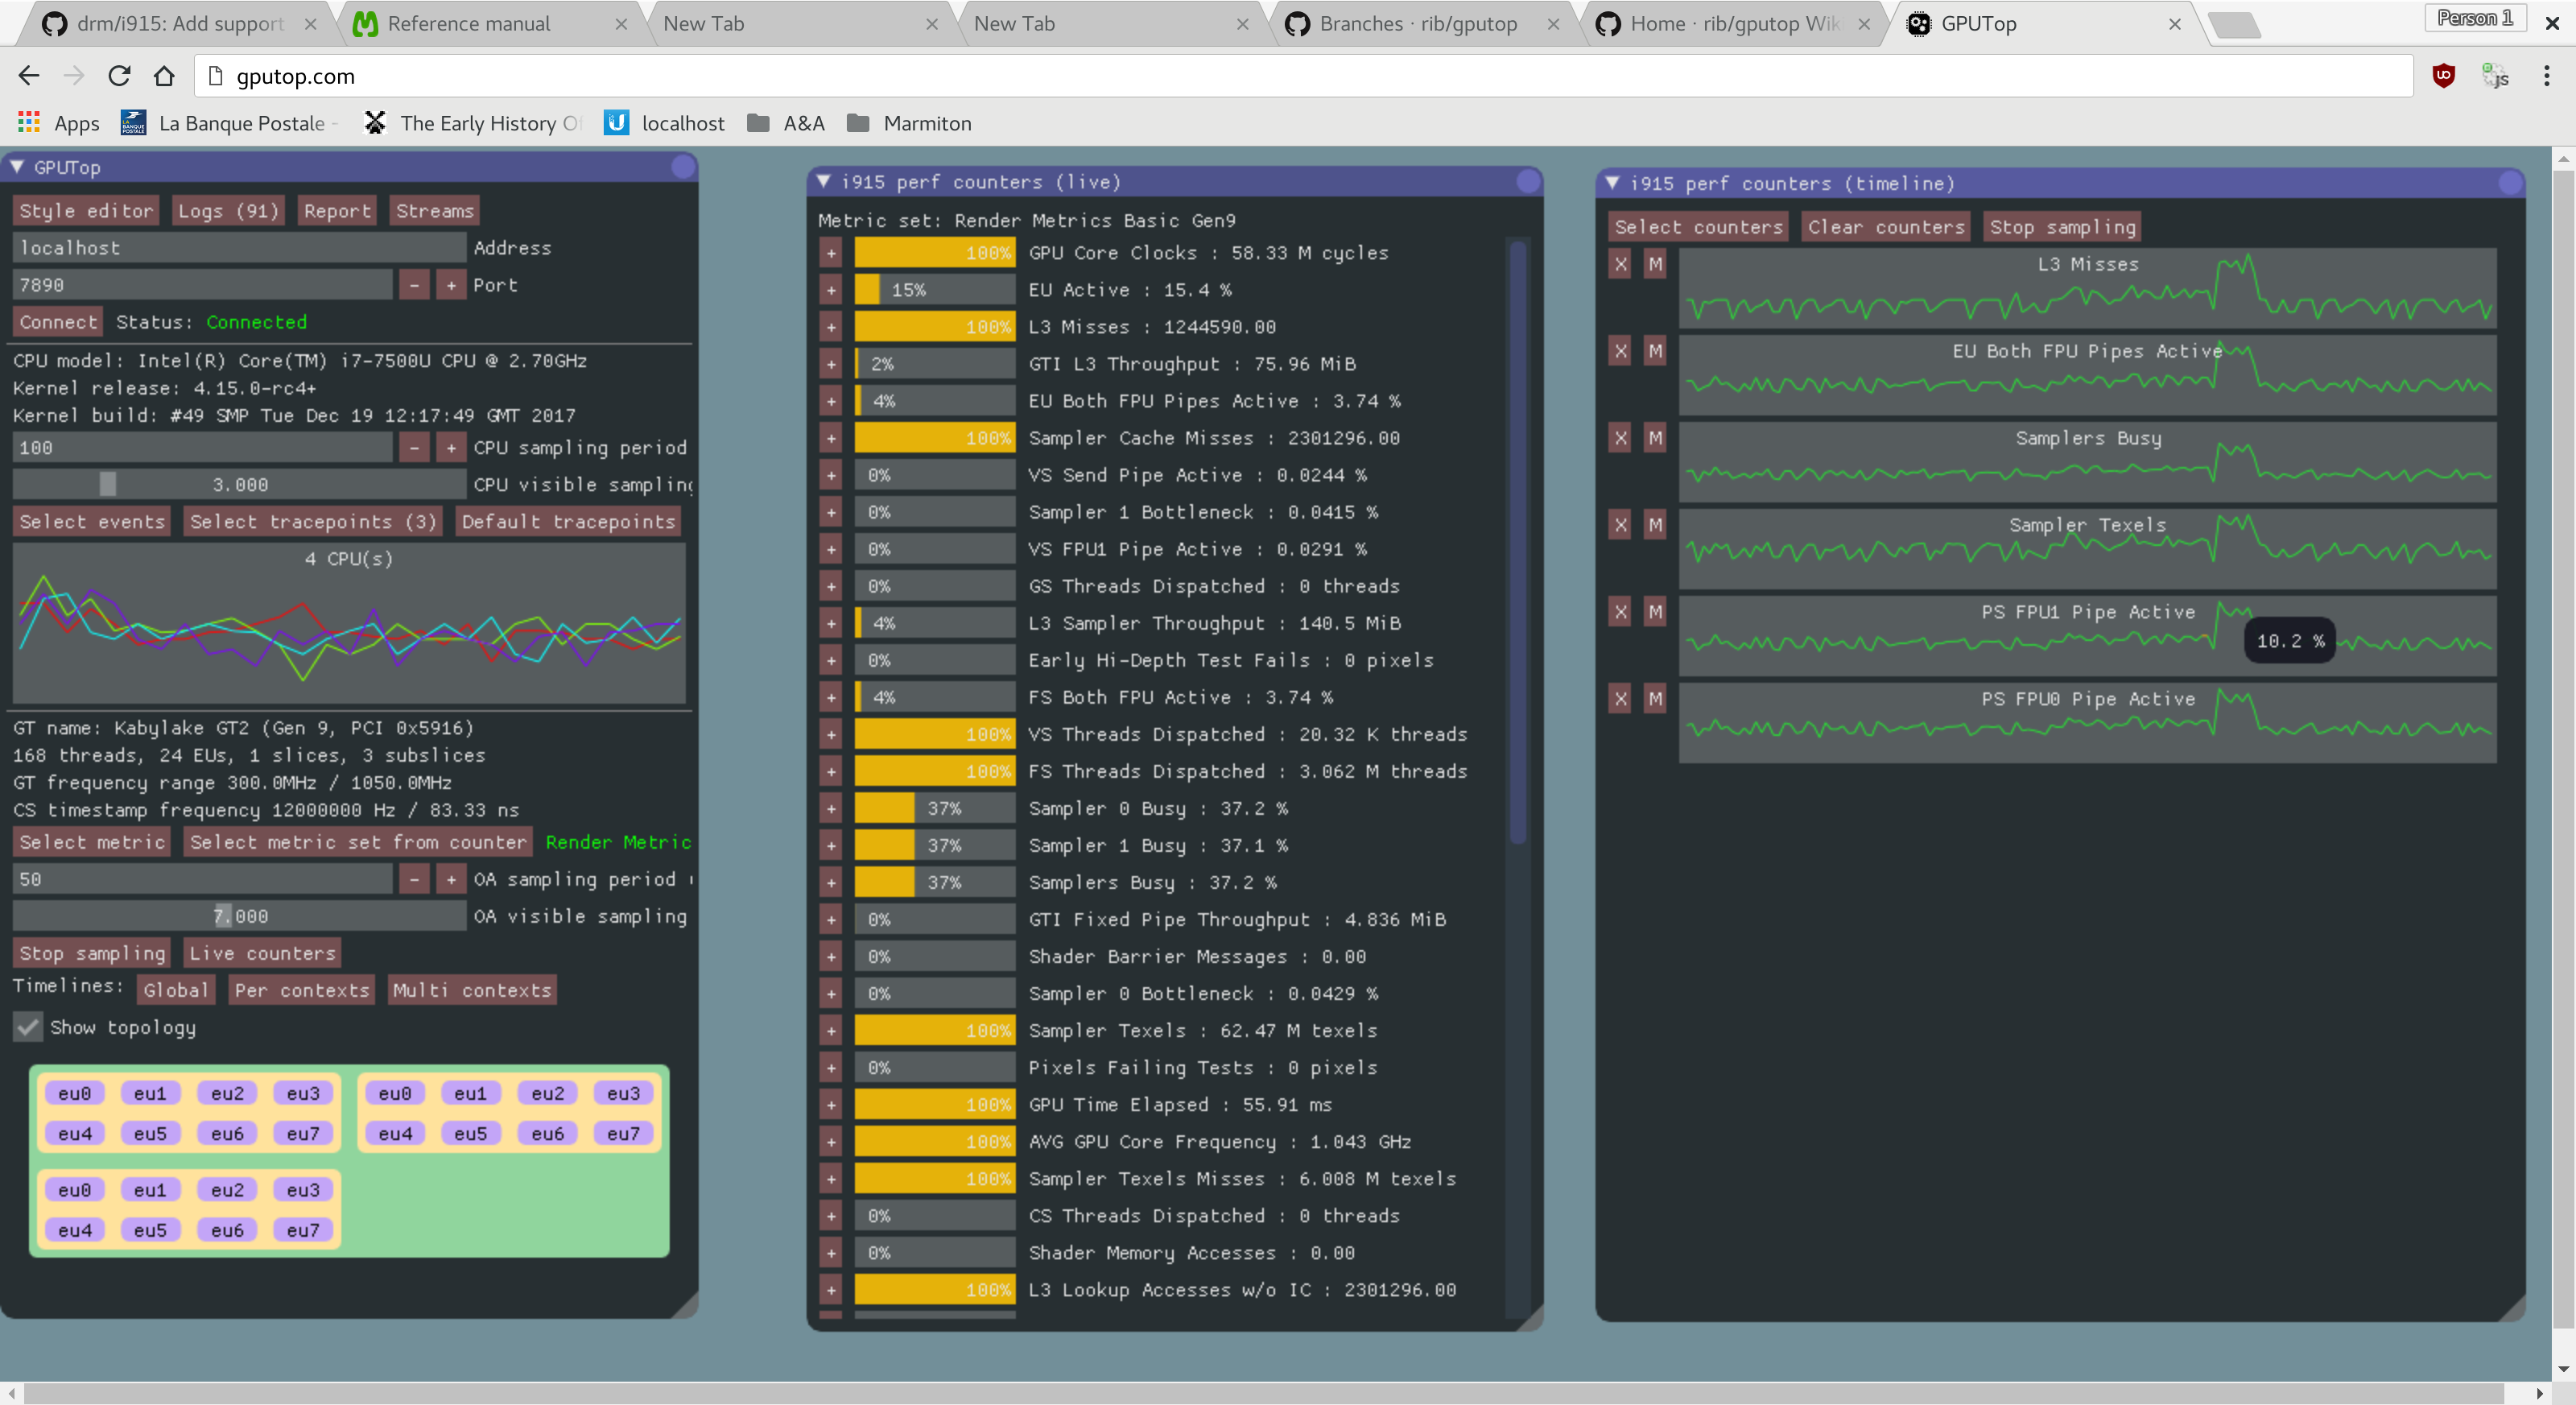
GPU Top is a tool to help developers understand GPU performance counters and provide graphical and machine readable data for the performance analysis of drivers and applications. GPU Top is compatible with all GPU programming apis such as OpenGL, OpenCL or Vulkan since it primarily deals with capturing periodic sampled metrics.
GPU Top so far includes a web based interactive UI as well as a non-interactive CSV logging tool suited to being integrated into continuous regression testing systems. Both of these tools can capture metrics from a remote system so as to try an minimize their impact on the system being profiled.
GPUs supported so far include: Haswell, Broadwell, Cherryview, Skylake, Broxton, Apollo Lake, Kabylake, Cannonlake and Coffeelake.
It's not necessary to build the web UI from source to use it since the latest tested version is automatically deployed to http://gputop.github.io
If you want to try out GPU Top on real hardware please follow these build Instructions and give feedback here.
Here's an example from running gputop-wrapper like:
gputop-wrapper -m RenderBasic -c GpuCoreClocks,EuActive,L3Misses,GtiL3Throughput,EuFpuBothActive
Firstly the tool prints out a header that you might want to share with others to help ensure your comparing apples to apples when looking at metrics from different systems:
Server: localhost:7890
Sampling period: 1 s
Monitoring system wide
Connected

System info:
	Kernel release: 4.15.0-rc4+
	Kernel build: #49 SMP Tue Dec 19 12:17:49 GMT 2017
CPU info:
	CPU model: Intel(R) Core(TM) i7-7500U CPU @ 2.70GHz
	CPU cores: 4
GPU info:
	GT name: Kabylake GT2 (Gen 9, PCI 0x5916)
	Topology: 168 threads, 24 EUs, 1 slices, 3 subslices
	GT frequency range: 0.0MHz / 0.0MHz
	CS timestamp frequency: 12000000 Hz / 83.33 ns
OA info:
	OA Hardware Sampling Exponent: 22
	OA Hardware Period: 699050666 ns / 699.1 ms
And then compactly prints the data collected. In this case the output was to a terminal and so the data is presented to be easily human readable. When output to a file then it will be a plain CSV file and numbers aren't rounded.
    Timestamp  GpuCoreClocks  EuActive      L3Misses  GtiL3Throughput  EuFpuBothActive
         (ns)     (cycles/s)       (%)  (messages/s)              (B)              (%)
 285961912416,770.9 M cycles,  0.919 %,   1473133.00,       89.91 MiB,         0.256 %
 286992496416,900.1 M cycles,   1.04 %,   2036968.00,       124.3 MiB,         0.316 %
 288190601500,521.4 M cycles,   1.81 %,   2030997.00,         124 MiB,         0.537 %
 289519269500,1.028 G cycles,   11.8 %,  33181879.00,       1.978 GiB,          3.82 %
 290562176250,1.007 G cycles,   11.1 %,  30115582.00,       1.795 GiB,          3.66 %
 291569408333,905.9 M cycles,     10 %,  24534419.00,       1.462 GiB,          3.18 %
 292590314500,762.4 M cycles,   6.89 %,  10934947.00,       667.4 MiB,          2.31 %
 293954678166,538.5 M cycles,   1.72 %,   2034698.00,       124.2 MiB,         0.543 %
 295323480416,751.6 M cycles,   1.28 %,   2034477.00,       124.2 MiB,         0.356 %