Releases: cyschneck/Star-Chart-Spherical-Projection
1.6.0 - starPositionOverTime, predictPoleStar, new stars
⭐ New functions for plotting and predicting a star's position over time and at a specific year ⭐
New functions are still in beta functionality and will continue to be tested and expanded
starPositionOverTime() and plotStarPositionOverTime()
Return a single star's position over time
starPositionOverTime(builtInStarName=None,
			newStar=None,
			startYearSince2000=None,
			endYearSince2000=None,
			incrementYear=5,
			isPrecessionIncluded=True,
			save_to_csv=None)
And associated function to plot the star's declination and right ascension position over time
plotStarPositionOverTime(builtInStarName=None,
			newStar=None,
			startYearSince2000=None,
			endYearSince2000=None,
			incrementYear=10,
			isPrecessionIncluded=True,
			DecOrRA="D",
			showPlot=True,
			showYearMarker=True,
			fig_plot_title=None,
			fig_plot_color="C0",
			figsize_n=12,
			figsize_dpi=100,
			save_plot_name=None)
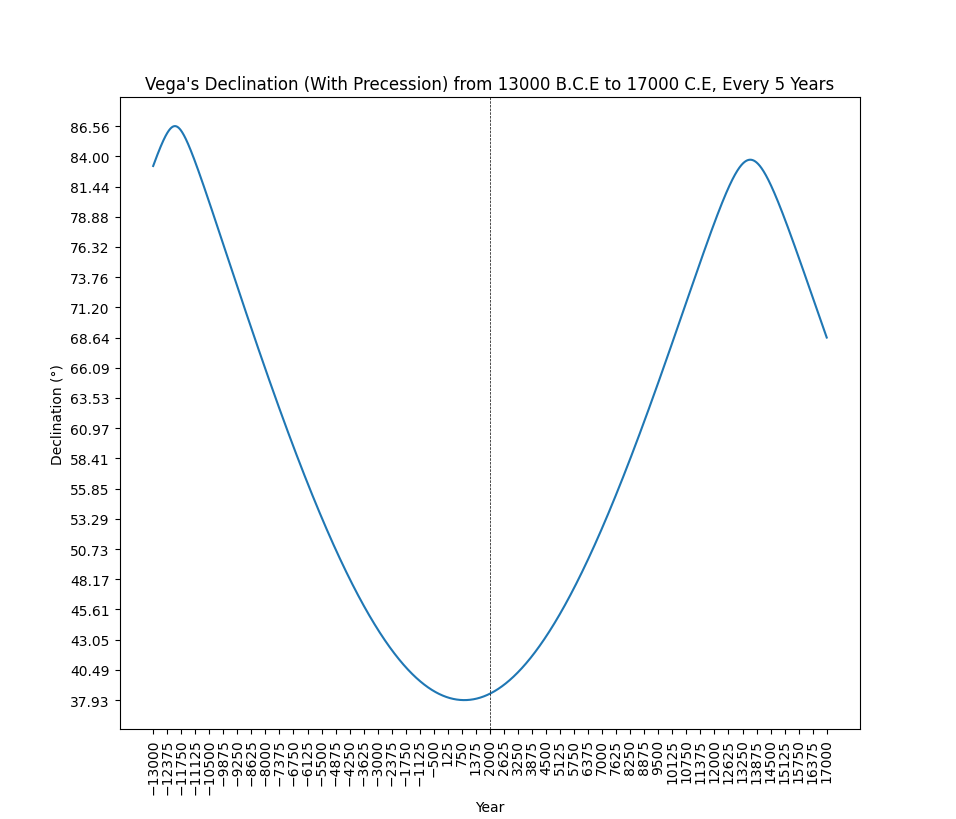
For example, Vega's Declination with Precession:
star_chart_spherical_projection.plotStarPositionOverTime(builtInStarName="Vega",
							newStar=None,
							startYearSince2000=-15000,
							endYearSince2000=15000,
							isPrecessionIncluded=True,
							incrementYear=5,
							DecOrRA="D")

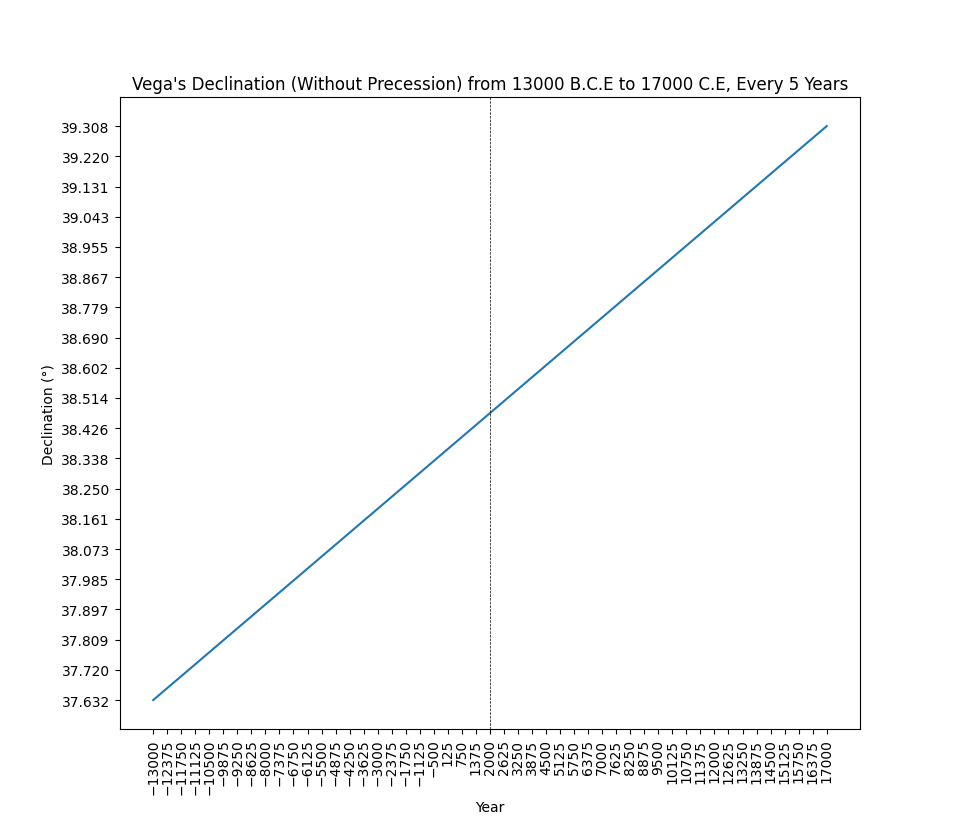
And Vega's declination without Precession:
star_chart_spherical_projection.plotStarPositionOverTime(builtInStarName="Vega",
							newStar=None,
							startYearSince2000=-15000,
							endYearSince2000=15000,
							isPrecessionIncluded=False,
							incrementYear=5,
							DecOrRA="D")
predictPoleStar()
Return the North/South Pole star for a given year since 2000 while taking into account precession
predictPoleStar(yearSince2000=0, northOrSouth="North")
New Built-In Stars
Alkaphrah, Alkarab, Alkes, Almaaz, Alnasl, Alfirk, Algedi, Algenib, Algorab, Aljanah, Alkalurops, Absolutno, Achird, Acubens, Adhafera, Adhil, Ain, Alafar, Ainalrami, Alasia, Albaldah, Albali
Bug fixes and README.md edits
Pytests: 158 tests on ubuntu, macOS, windows
Add New Stars and Save Output to CSV
Add a New Star to Existing Data with newStar Class
- Users can now add new stars (fix to Issue 1)
- Two methods to add new stars to a plotStereographicProjection() and finalPositionOfStars()
- newStar(starName=None, ra=None, dec=None, properMotionSpeed=None, properMotionAngle=None, magnitudeVisual=None)
- A new star with a proper motion speed and a proper motion angle
- newStar(starName=None, ra=None, dec=None, properMotionSpeedRA=None, properMotionSpeedDec=None, magnitudeVisual=None)
- A new star with the proper motion speed for right ascension and declination
userListOfStars -> builtInStars
- Renamed argument
userListOfStarstobuiltInStars
New argument to plotStereographicProjection()
- userDefinedStars: List of newStar objects of stars the user has added
- onlyDisplayUserStars: Only display the stars defined by the users (userDefinedStars)
New argument to finalPositionOfStars()
- userDefinedStars: List of newStar objects of stars the user has added
- onlyDisplayUserStars: Only display the stars defined by the users (userDefinedStars)
- save_to_csv: CSV filename and location to save final star positions with headers ["Star Name", "Right Ascension (HH.MM.SS)", "Declination (DD.SS)"]
New Built-In Star
- Thuban with updated star_data.csv
Bug fixes and README.md edits
New pytest for additional arguments: 141 tests
Pytests: 82 tests
82 error handling pytests for:
- finalPositionOfStars()
- plotSterographicProjection()
finalPositionOfStars() and README edits
- Release for new function: finalPositionOfStars() returns a dictionary of the position of stars
- Update to README for edits
maxMagnitudeFilter optional flag
Set up maxMagnitudeFilter optional flag and adds additional stars (total = 107)
Bug fix for displaying Year
Bug fix: BCE = -2000 years ago
if yearSince2000 >= -2000: year_bce_ce = "{0} C.E".format(yearSince2000 + 2000) # postive years for C.E
if yearSince2000 < -2000: year_bce_ce = "{0} B.C.E".format(abs(yearSince2000 + 2000)) # negative years for B.C.E
showPlot() optional argument
New optional argument for generating charts "showPlot" (defaults to True) that triggers plt.show(). Can turn off showing plot, useful for running multiple charts at once
plotStereographicProjection(userListOfStars=[],
northOrSouth=None,
declination_min=None,
yearSince2000=0,
displayStarNamesLabels=True,
displayDeclinationNumbers=True,
incrementBy=10,
isPrecessionIncluded=True,
showPlot=True,
fig_plot_title=None,
fig_plot_color="C0",
figsize_n=12,
figsize_dpi=100,
save_plot_name=None)
userListOfStars with error handling
userListOfStars with error calls for current stars
v1.1.2 Minor edits
Minor edits to README
Beta release: Precession of the equinoxes
New flag for including precession for long-scale star charts, defaults to True (isPrecessionIncluded)
