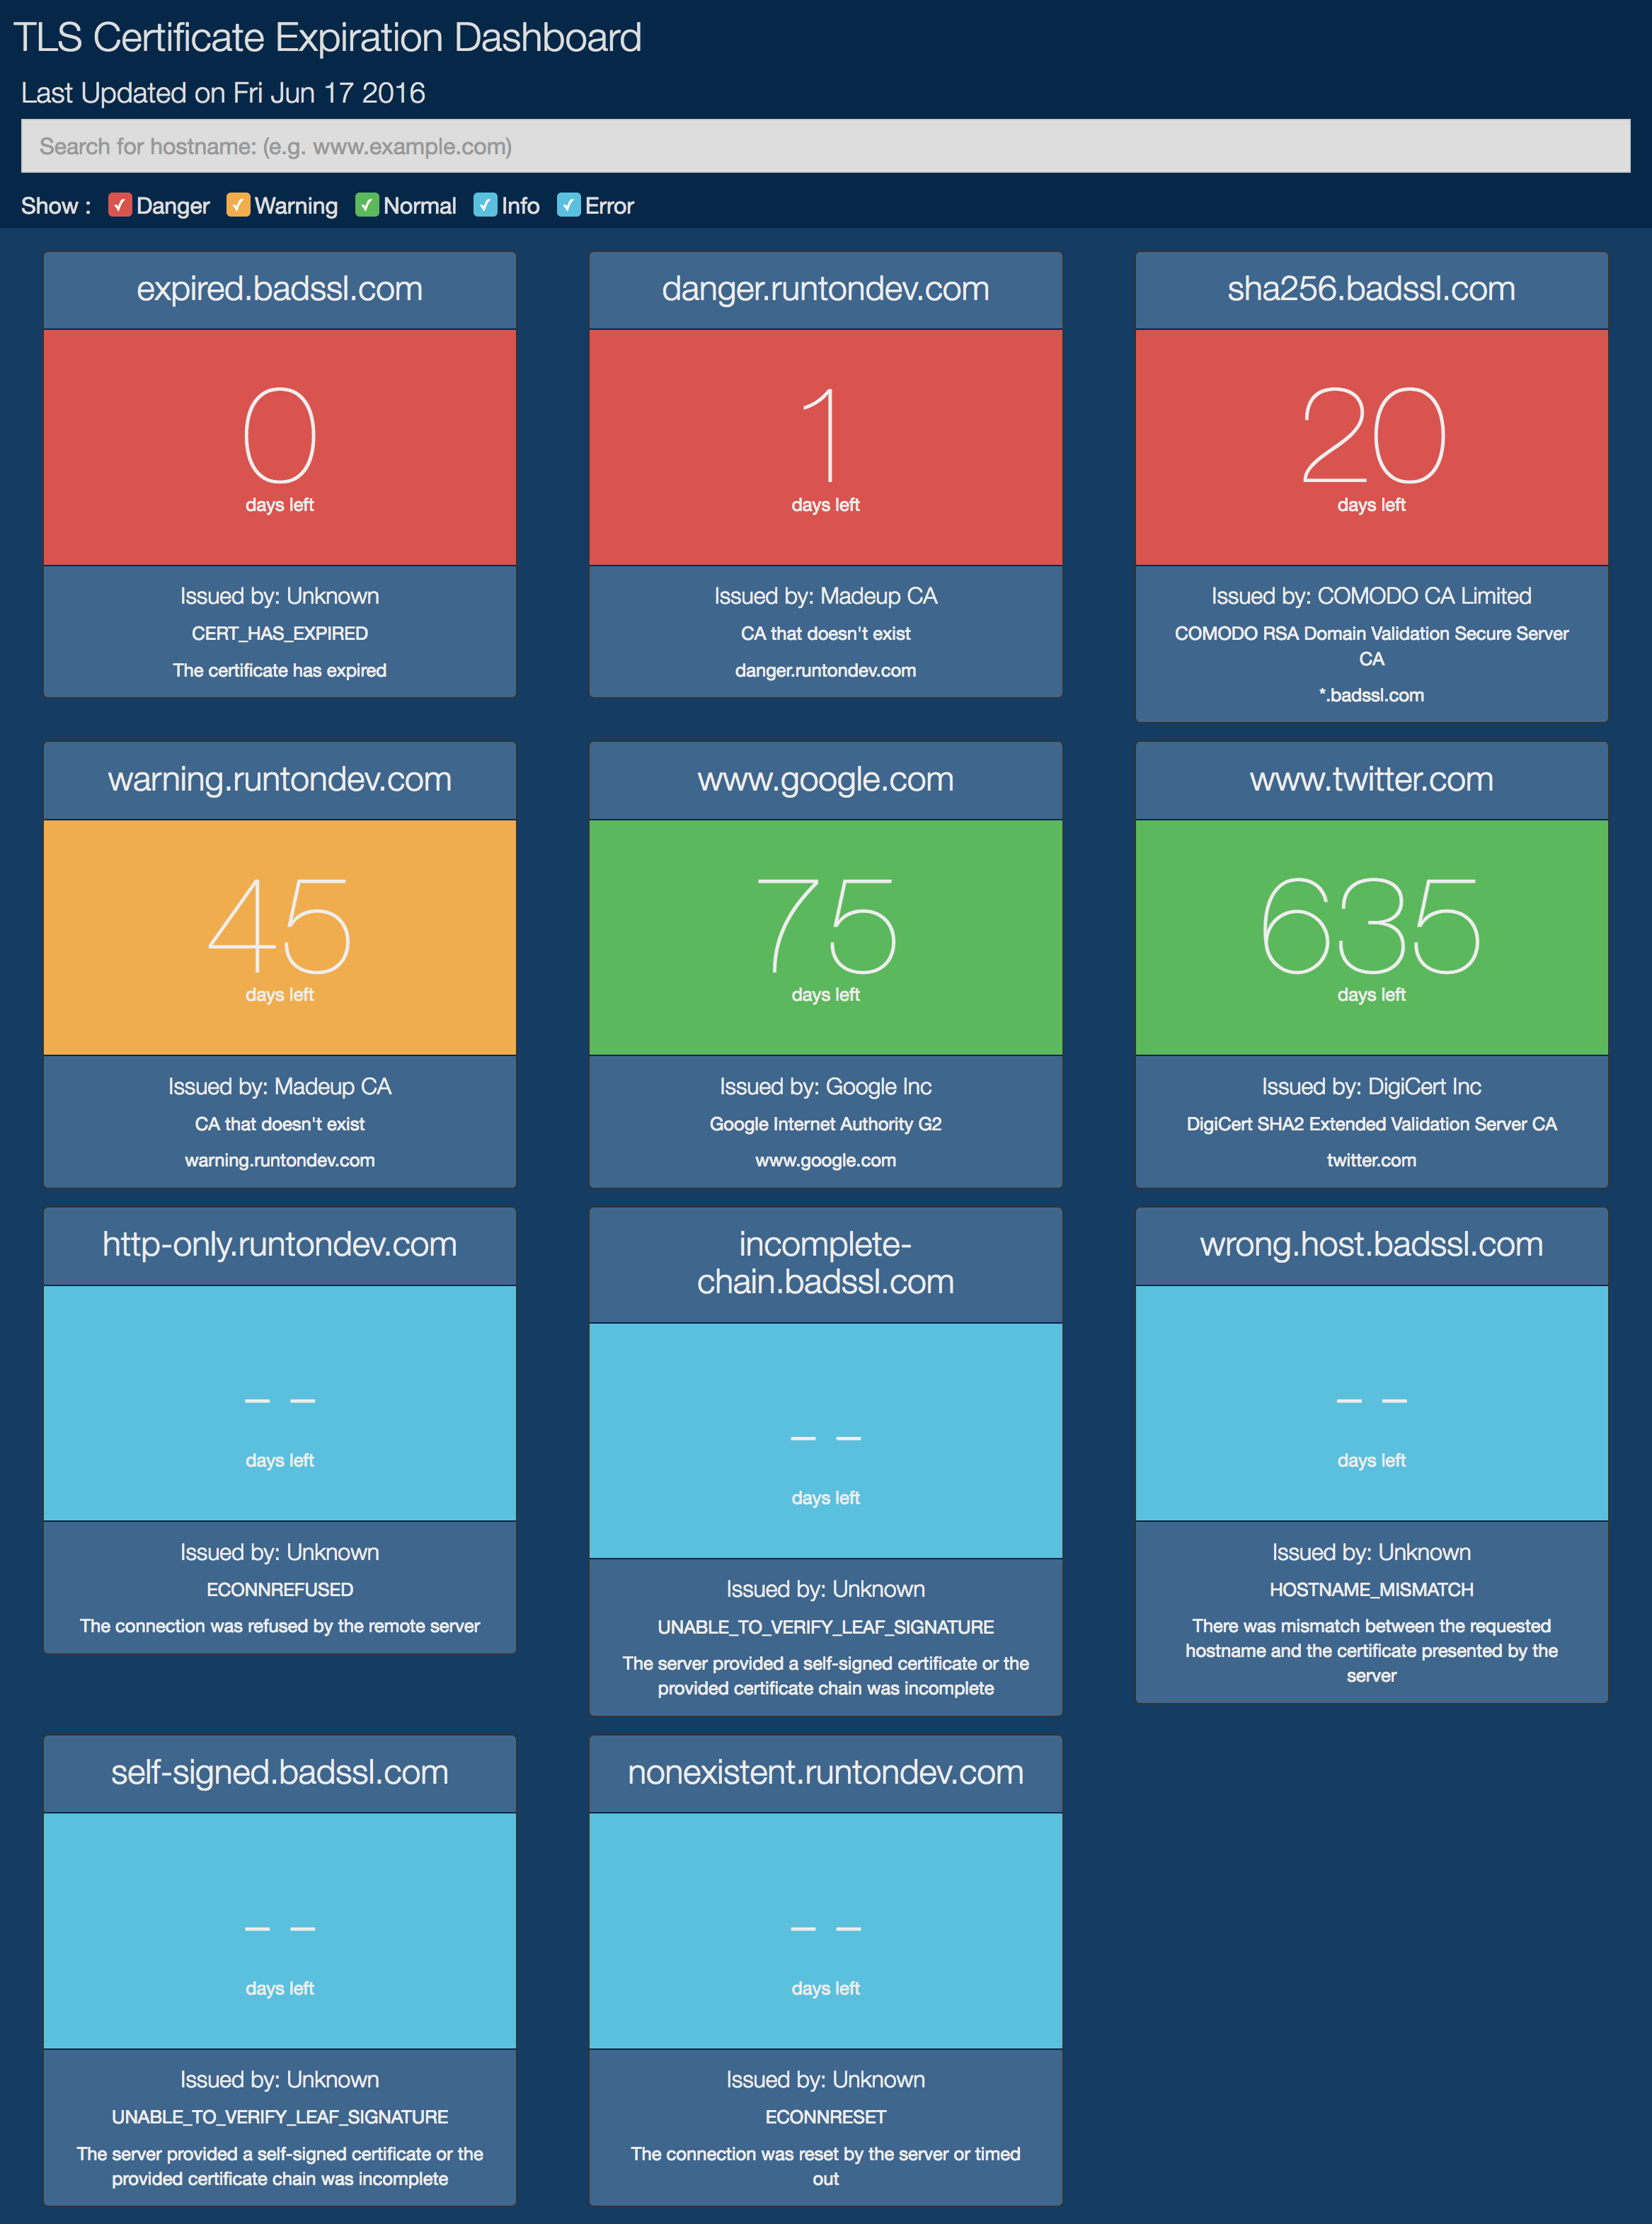
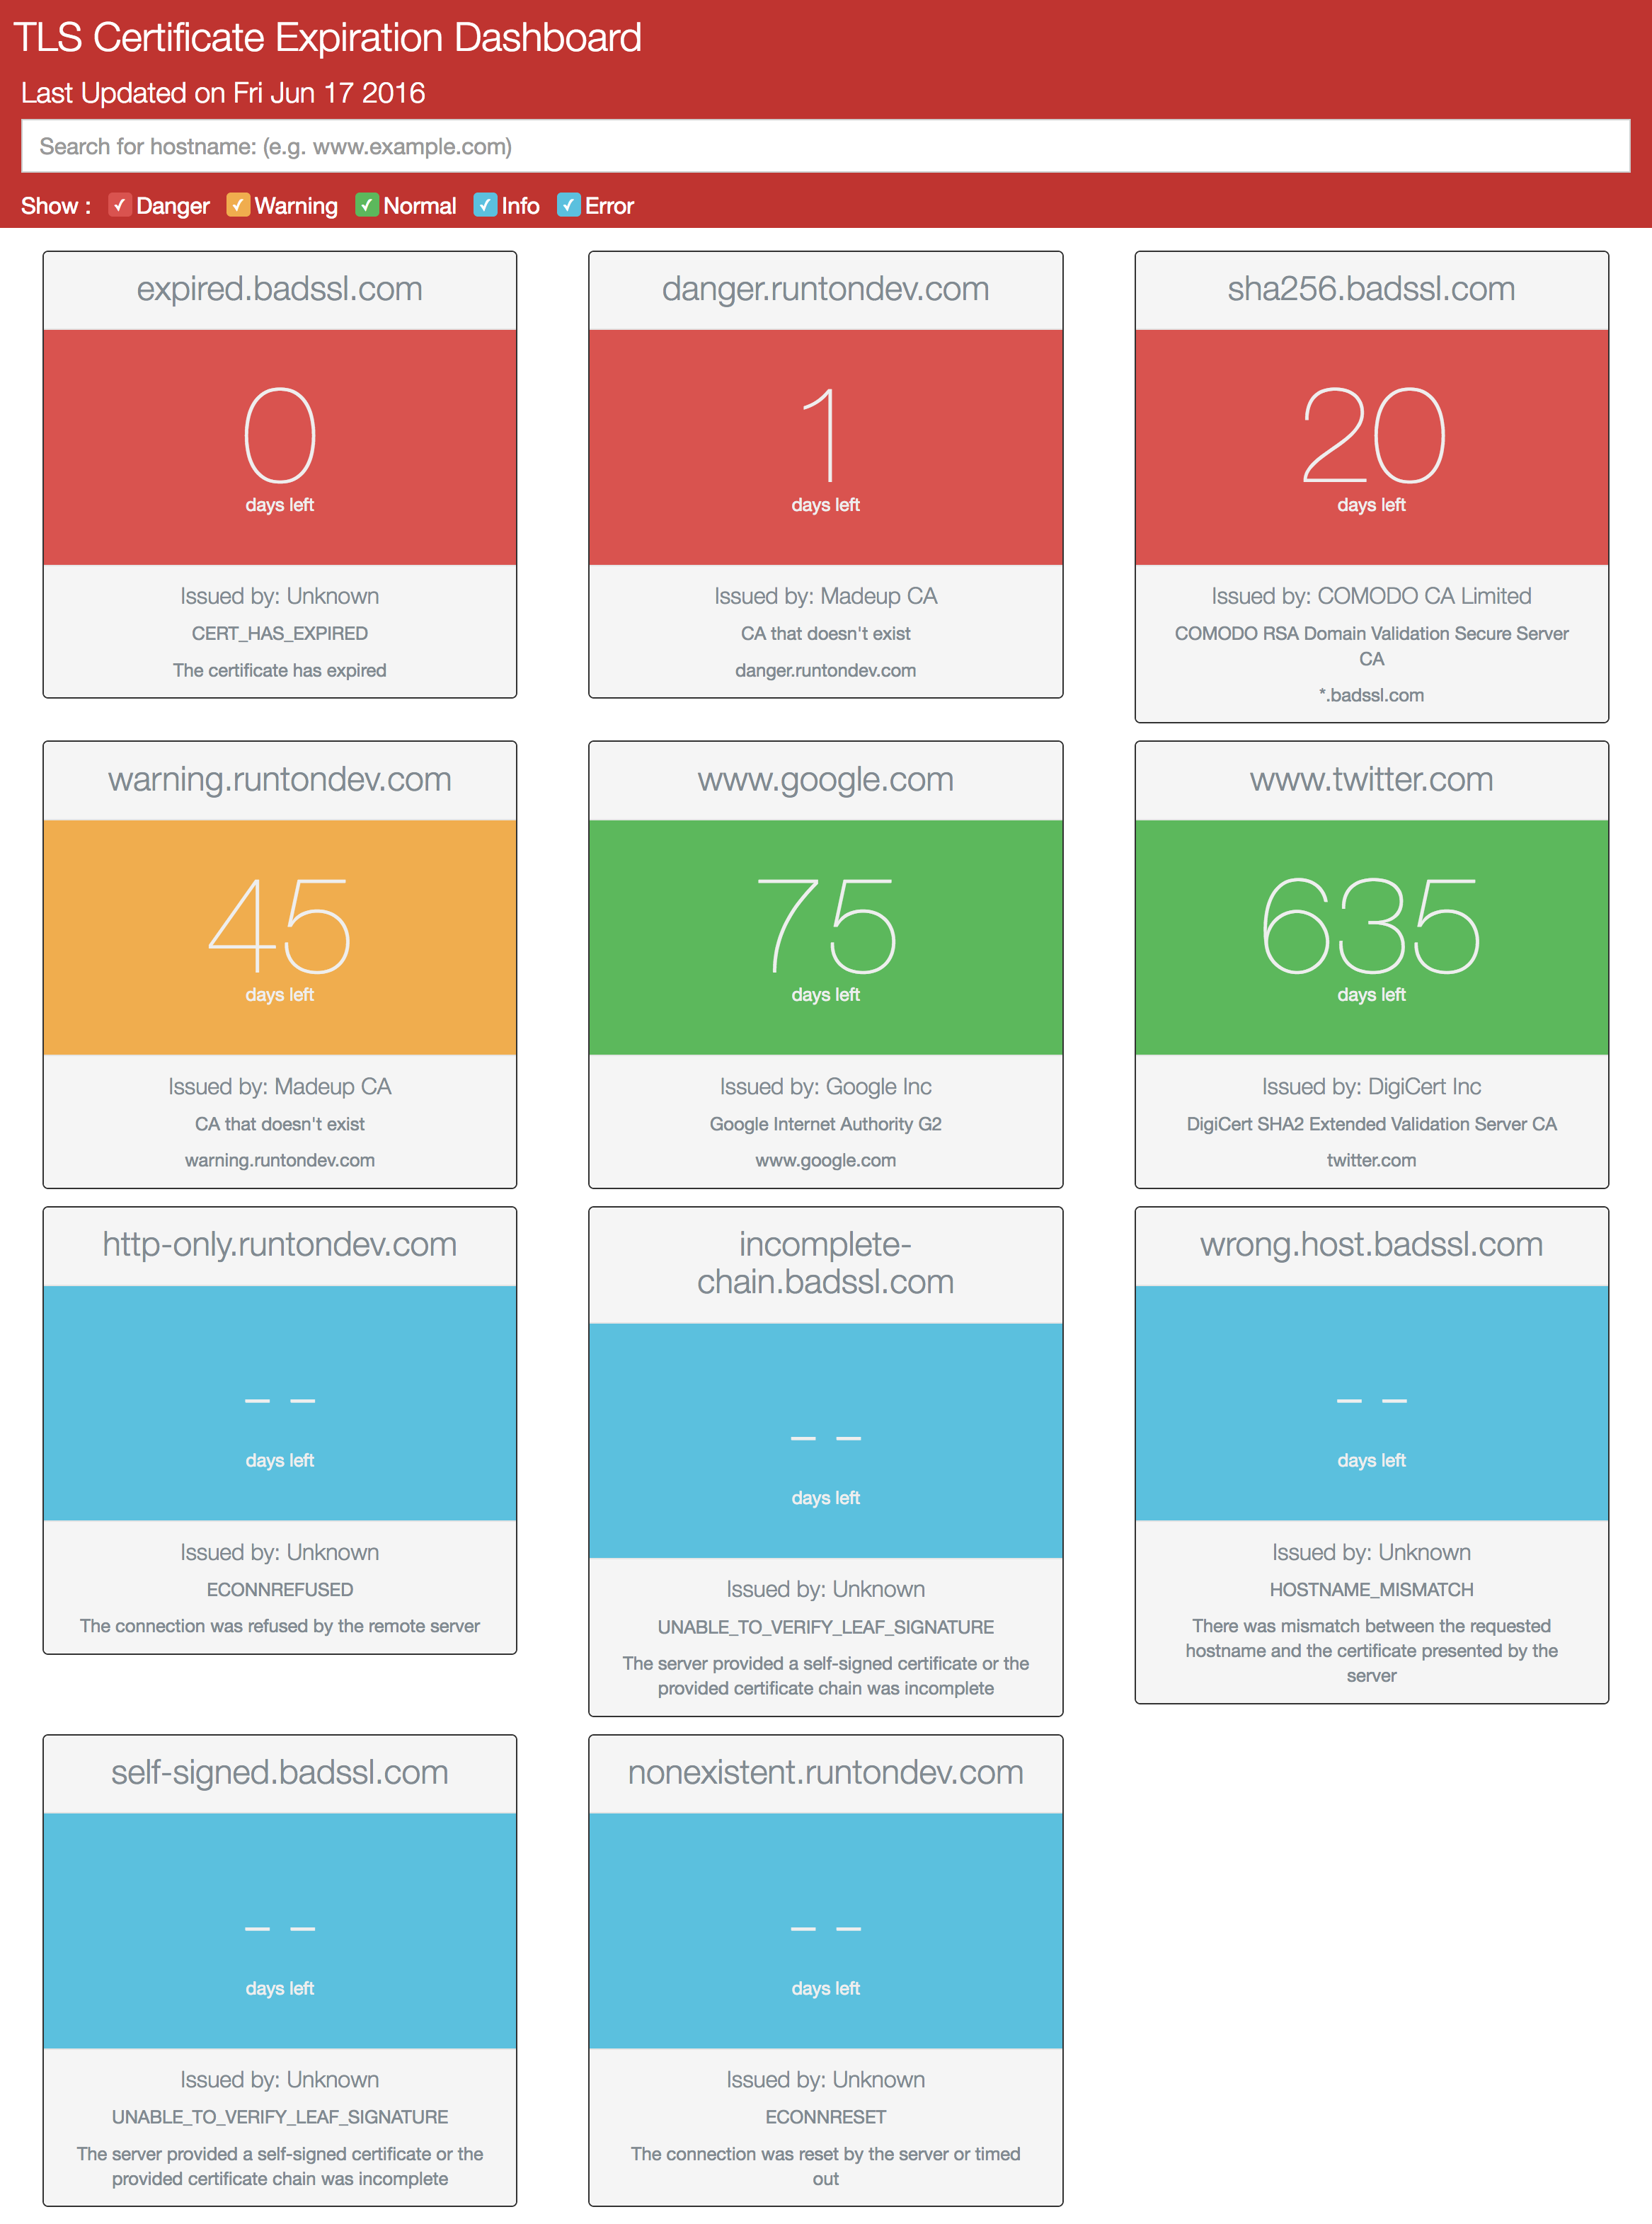
A dashboard written in JavaScript & HTML to check the remaining time before a TLS certificate expires. A combination of a Node module and an HTML/CSS/JS webpage to display the info.
Copy node_app/example_config.js to node_app/config.js. You won't need to change the defaults unless you want a special snowflake. Contains the configuration variables for the node script, as described below.
connection_timeout- The time in milliseconds that node should leave a connection open without response after the socket has been assigned. Once the timeout expires, node emits atimeoutevent and aborts the connection request. Default is 5000ms.output_filepath- The path to the directory that you want the output file written to. Can be relative or absolute, requires a trailing/, and defaults to the../web_service/js/tls-dashboard/directory. If you move the contents of the./web_servicedirectory, make sure you update this path.name- The name of the output file. This typically doesn't need to be changed, but if you do change it, you'll also need to change the filename inindex.htmlat line 14.
Copy the node_app/example_monitored_hosts.js to node_app/monitored_hosts.js. Contains an array of all of the hostnames that you want to monitor. Modify this array for all of the hosts that you want to monitor.
This module performs the actual HTTPS connection and evaluation of the peer certificates, and outputs the results into a flat file. There are no configuration changes needed in this file. To get things going, you can either:
- Run the script manually whenever you need to update your dashboard by calling
node get_cert_info.js; or - Set up the script to run on a cronjob
It's entirely up to you how you want to handle it.
If you're using this on a local machine, and you haven't made any changes to the default config, then once you've ran node get_cert_info.js as described above, all you have to do is open the web_service/index.html file in your browser of choice. All of the dependencies are there and the links are relative, so you should be good to go.
To get the web service started on a remote server, you'll need to either move the contents of the web_service directory to somewhere in your web site's path, or create a symlink (recommended if you're using Git to deploy) from the web site path back to the directory. If you move the contents, please update the output_file.path config value. Again, since all of the Dashbaord's dependencies are in the web_service directory, and the links are relative links, there's nothing else you need to change.
The dashboard now defaults to a darker theme because I liked it better. If you want to enable the light theme again you can. Just edit line 11 of the web_service/index.html file from
<link rel="stylesheet" href="./css/tls-dashboard/styles-dark.css" type="text/css" />to
<link rel="stylesheet" href="./css/tls-dashboard/styles-light.css" type="text/css" />and that will bring back the lightness.
Take a look at a live example pages on GitLab. Dark one here, and the light one here. Screenshots below.
- Database integration?
- Slack integration?
- Monitor CRLs
- Non-standard
ports/paths?
The node module has no dependencies external to the node core. The following dependencies are provided for the web service to render properly.
- jQuery v3.1.0
- Handlebars v4.0.5
- Bootstrap v4.0.0-alpha (CSS only)
Thanks to flatlogic on GitHub for the checkbox styling, the Bootstrap team, the jQuery team, the Handlebars team, and the Twitter Typeahead team.


