author: Claudio Bellei
--------------------
DYNAMIC TIME WARPING
--------------------
> dtw(ts1=[],ts2=[],plot=False,test=False)
Input: ts1, ts2 (timeseries)
Output: cost (distance between the warped time series)
options:
1. plot. If True, plots a few figures.
2. test. If True, uses the test data
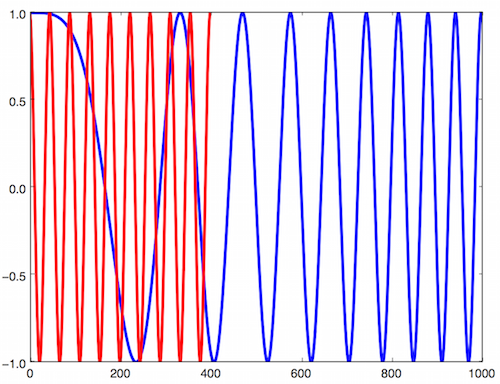
ts1 = np.cos(2*np.pi*(3*np.arange(1,1001,dtype=float)/1000)**2)
ts2 = np.cos(2*np.pi*9*np.arange(1,400,dtype=float)/400)dtw(plot=True,test=True)The basic test will find the warped distance between the following two functions
ts1 = np.cos(2*np.pi*(3*np.arange(1,1001,dtype=float)/1000)**2)
ts2 = np.cos(2*np.pi*9*np.arange(1,400,dtype=float)/400)
that are plotted below
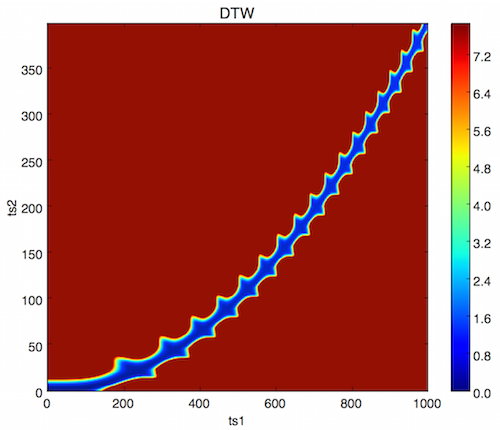
The algorithm leads to the construction of a two-dimensional matrix, from which we can find the warped map between the two time series
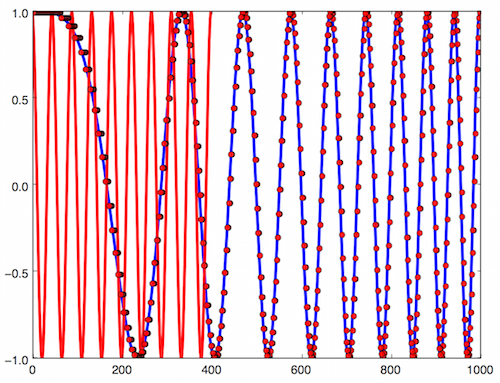
Finally, the mapping between the red and blue curves can be shown