This tool parses laboratory results taken from medico into a pre-defined format that you can easily paste in your excel table.
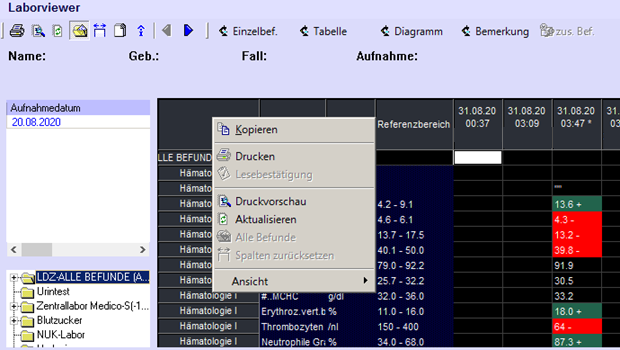
Simply copy the selection out of the medico laboratory viewer(works for cummulative and single data entries):
And paste it to the top left field in your labtool profile:
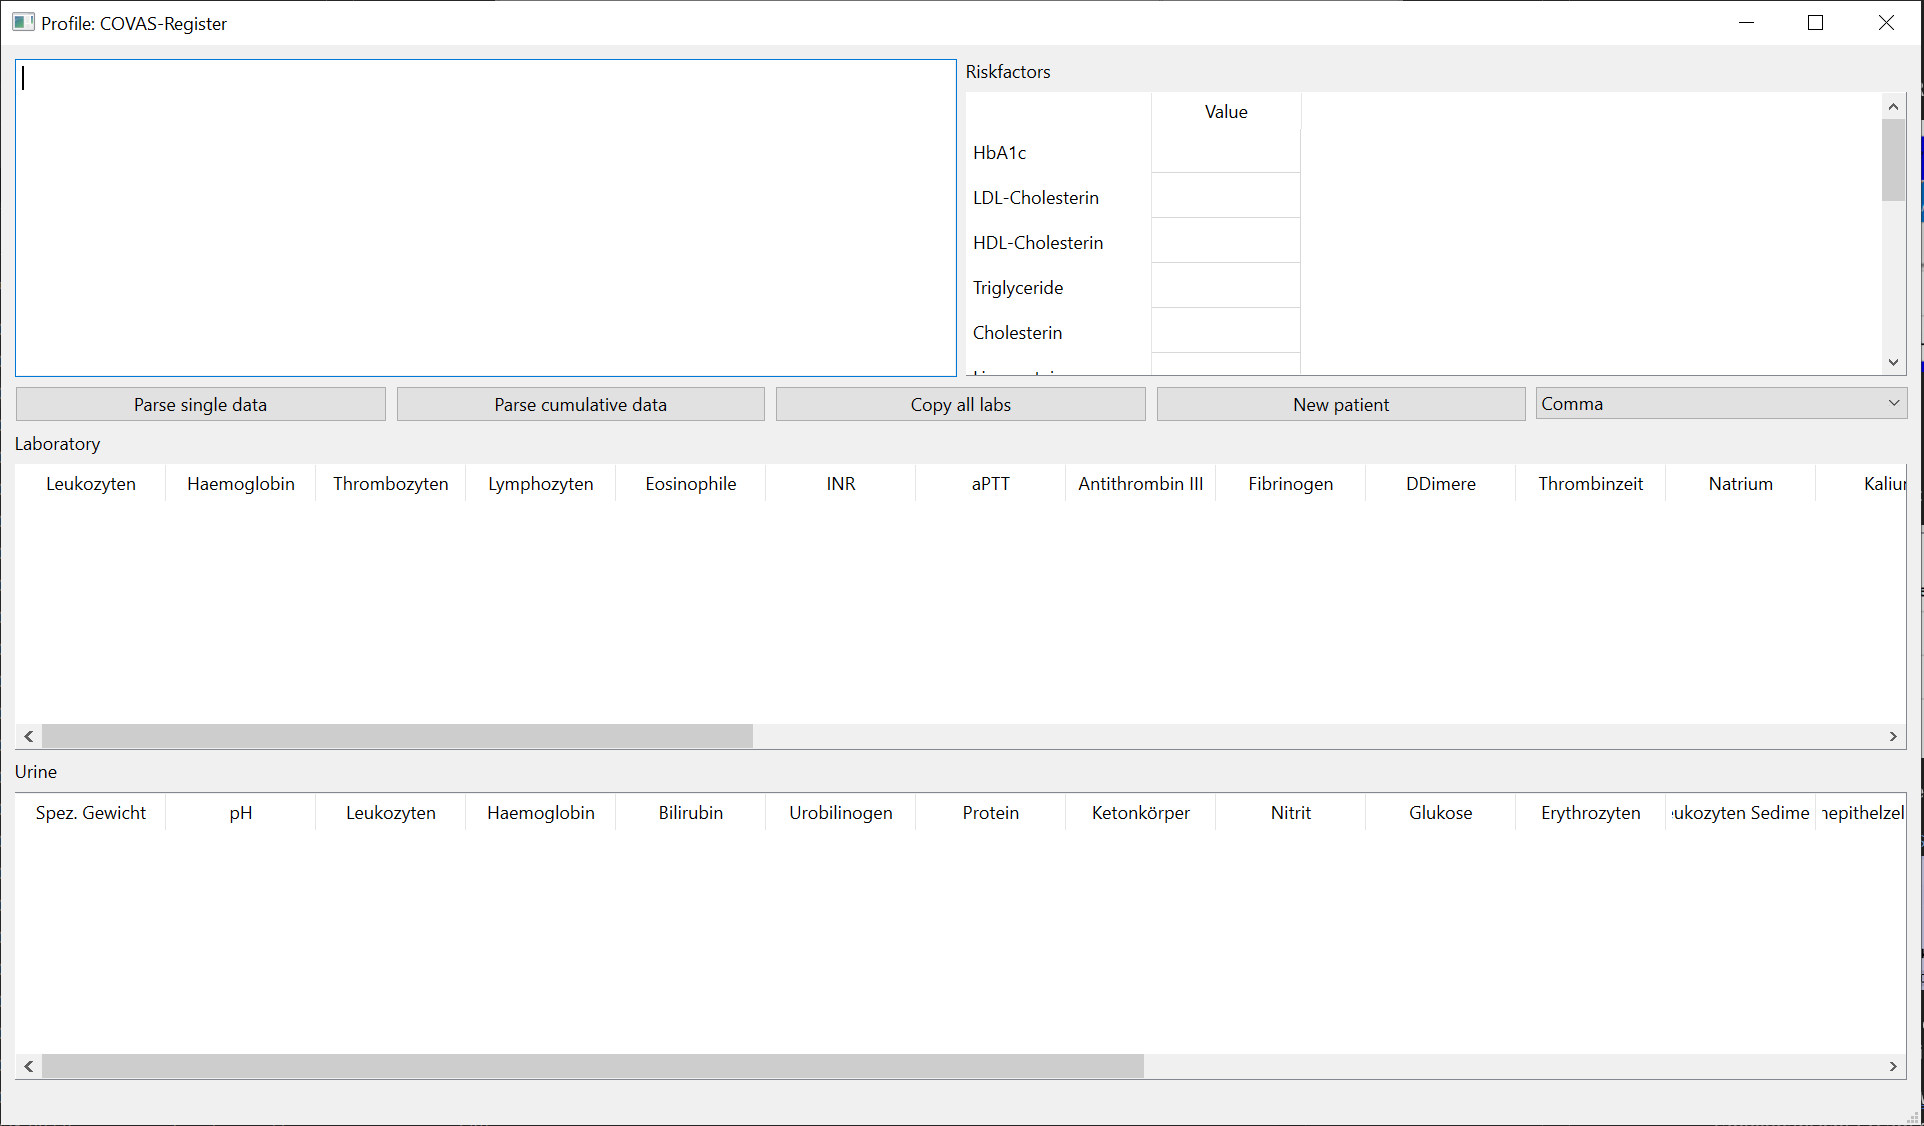
Then either press the "Parse single data" or "Parse cummulative data" button depending on whether or not you have copied data from the medico cummulative or single report view and the data will appear in your respective tables.
Then you can start manipulating the data in labtool and copy it to tab seperated format by right clicking the rows you need!

Labtool supports vertical and horizontal excel tables:
These represent baseline characteristics, which don't change between measurements. As such labtool saves the first available data point in each parse into the "Values" column. This means that if a parameter isn' present in the first laboratory result in your data but in the second, third etc. labtool uses the first available data! Labtool does not overwrite existing data points!
These represent your typical time series data, each laboratory result in medico is inserted as a new row in chronological order. You can then select multiple lines with shift+leftclick to merge results from consecutive rows into the first row without overwriting values already available in the first row.
This is useful if you want to for example combine a point of care blood gas analysis from 6:30am with a complete blood count from 6:50am.
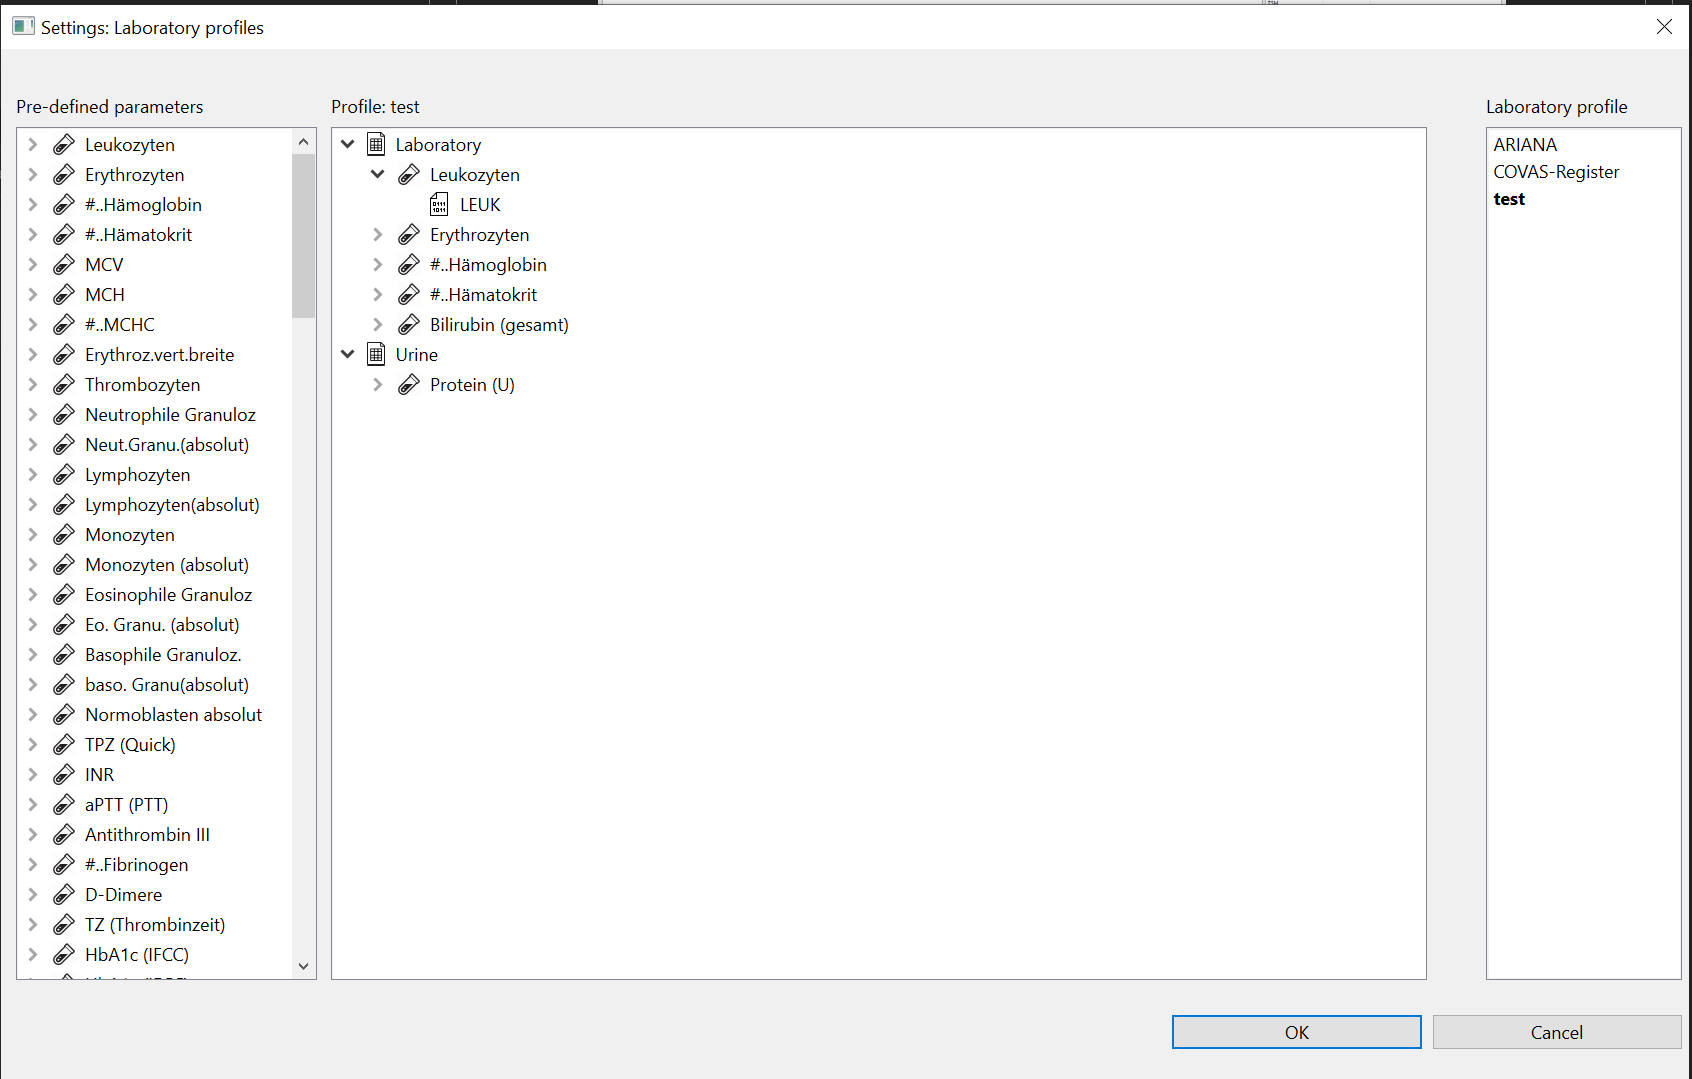
Profiles can be created and modified via settings->profiles, you can drag and drop, right click to add/modify parameters and tables