This is a non-exhausive collection of projects I've completed over the years highlighting skills across the data science spectrum including data wrangling, hypothesis testing, database management, visualization, machine learning and deep learning.
- When my fiance and I were planning our wedding in 2021, one of the biggest decisions was picking a date. Being a statistician, naturally I wanted to see a probabilistic outlook of temperature and precipitation risk on a given date and choose the date with the highest probability of good weather. Since we couldn't find this information readily accessible on the various weather apps or farmers almanacs, we decided to build this app to do it ourselves! Using this app as an input, we ended up choosing April 24th, and we were blessed by the Bayesian gods with a perfect sunny day with high temp in the mid-80s (which was higher than expected but within one standard deviation of the mean, so not too unlikely). We decided to publish the app publicly to help other couples or anyone else planning an outdoor event.
- Data source: 30 year weather normals data published by the NOAA for 1990-2020. Scope is limited to the US. source
- For a given location and desired temperature range, the app will output the date with the highest probability of good weather (defined as high temp within your desired range and minimal chance of rain) along with a time series to visualize the output over the year.
- App is hosted by Streamlit and the UI is still a work in progress.

- Research project led by UTHealth School of Public Health in partnership with Baylor College of Medicine and Harris County Public Health.
- Through this research project, we provide free testing for everyone in Harris County and collect data to better understand the spread of Covid-19 in this geography.
- My responsibilities include data architecture, collection, cleaning, analytics, and visualization.
- Public dashboard linked here

- Built classification model to predict churn of credit card customers for a bank.
- Optimized Linear Regression, Random Forest, and XGBoost with grid search cross validation.
- Introduced novel modeling approach with random undersampling, tomek link elimination, and xgboost bagging to to achieve better positive class Recall on noisy, * label imbalanced data.
- Conducted ROI analyis by considering customer lifetime value (LTV), cost of false positives/negatives, and cost of intervention to retain customers.
- Presented recommendation for final model and summarized learnings for similar problems.

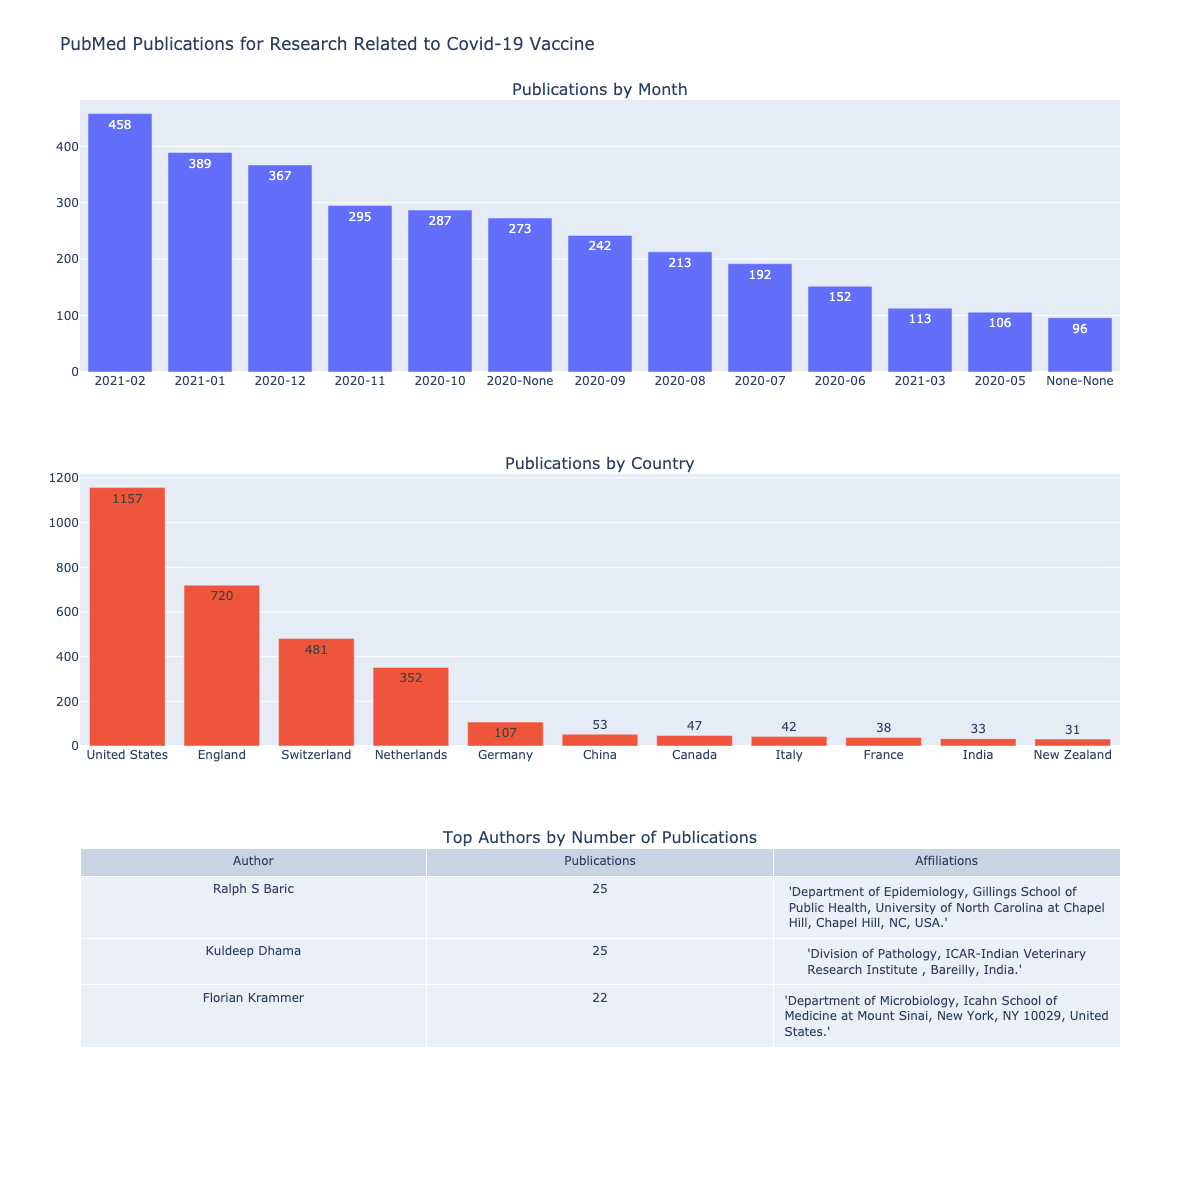
- Pubmed crawler module that collects publication details from PubMed for a given keyword (i.e., COVID-19 Vaccine) and time period.
- Database module that creates a SQLite database, populates tables, and queries tables for data needed for visualization.
- Visualization module that produces a dashboard summarizing key statistics related to COVID-19 vaccine publications.
- Automation module to automatically run script and update visualization weekly using AWS and cron.
- Applied matrix factorization algorithm to generate recommended items for users returning to an e-commerce website.
- Created Flask webservice to train model and predict new items for a given user through API requests.
- Containerized app with Docker so it can be run from any machine/environment.

- Evaluated the hypothesis that university towns have their mean housing prices less affected by economic recessions.
- Collected data on housing prices from Zillow, college towns from Wikipedia, and GDP from Bureau of Economic Analysis, US Department of Commerce
- Conducted t-test to evaluate hypothesis
- Found that housing prices in college towns are less affected during recessions compared to non college towns. Also, found no significant relationship between college town status and housing price changes in the period leading up to the recession or the recovery after the recession.
