-
Notifications
You must be signed in to change notification settings - Fork 246
Interpolation
Jeremie Deray edited this page Jan 10, 2019
·
2 revisions
manif provides three interpolation algorithms in the subfolder algorithms.
They are:
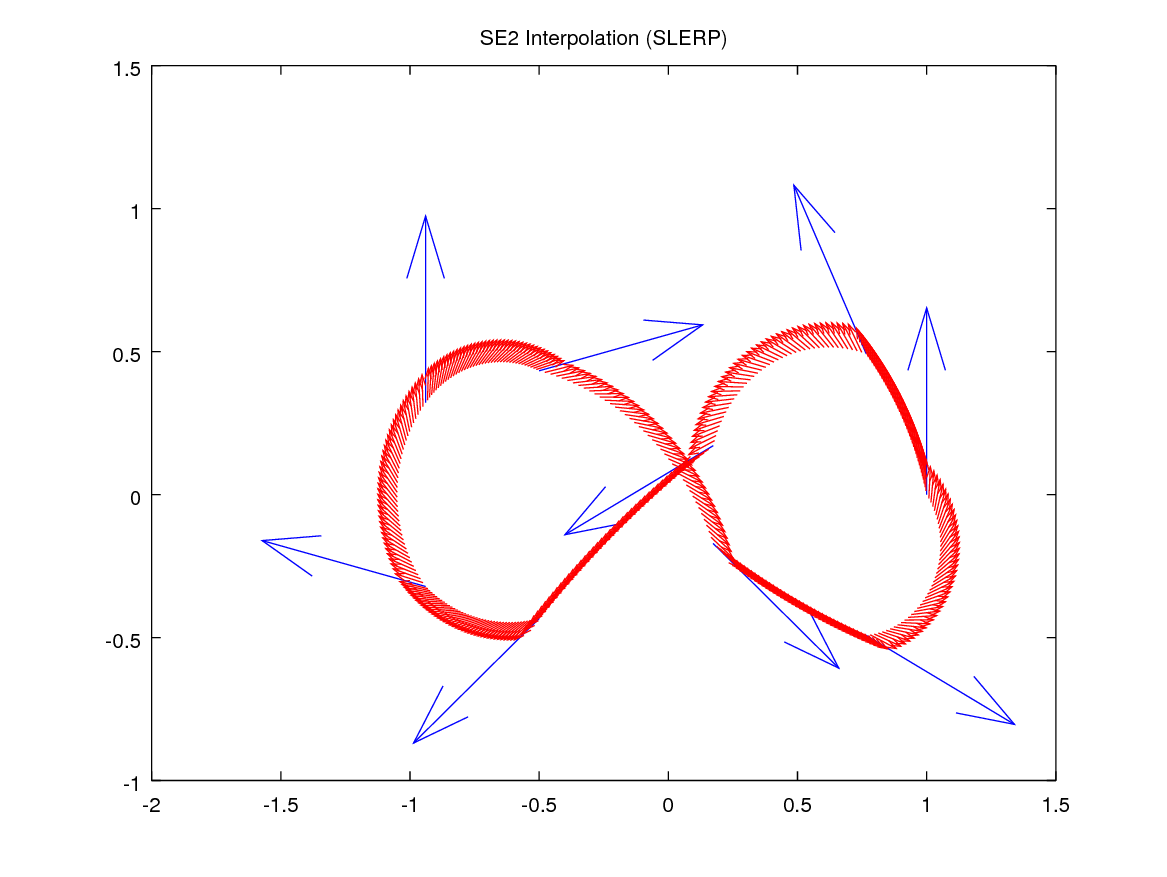
- Slerp interpolation
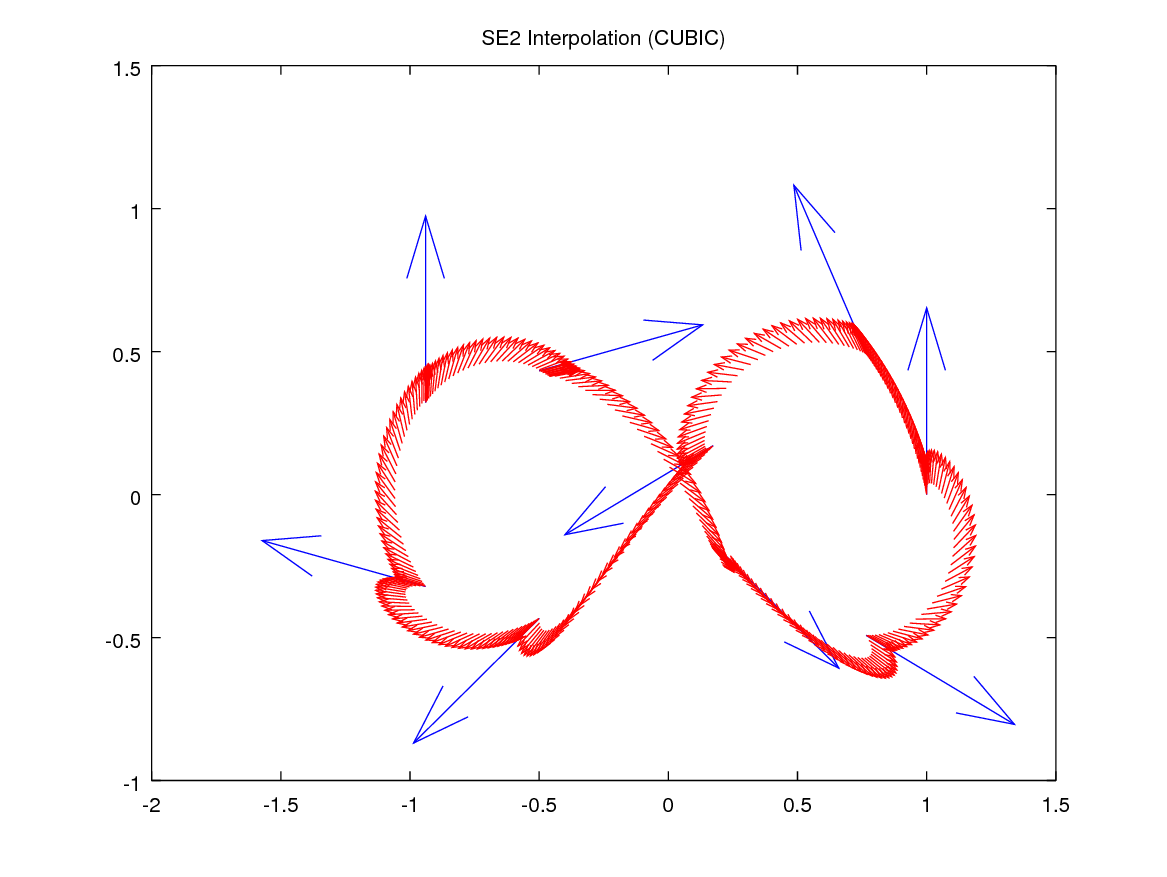
- Cubic interpolation
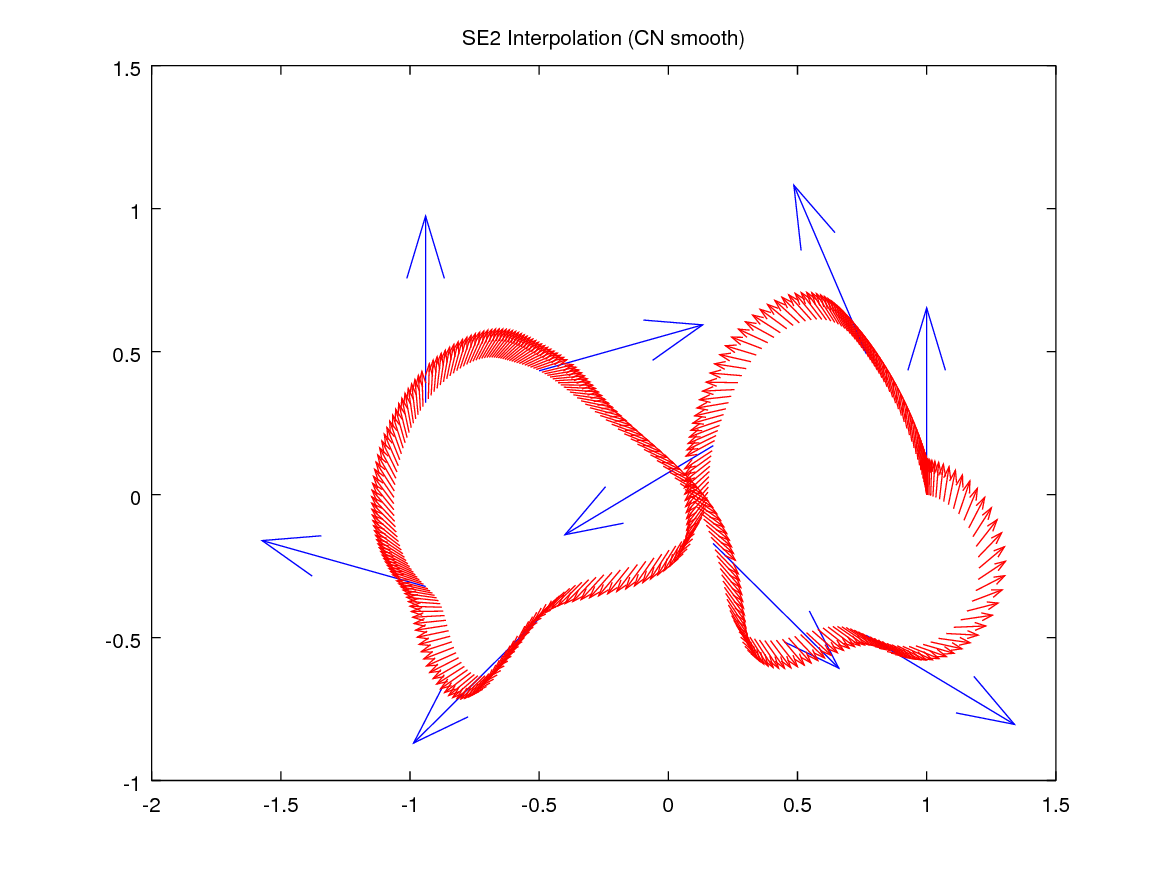
- CN-smooth interpolation
A brief usage example is shown in examples/se2_interpolation.cpp.
In this example, k points in SE2 are generated on a 8-shaped curve (large blue arrows). Between consecutive points, p new points are interpolated (in ]0,1[, smaller red arrows). The results for each interpolation algorithm is shown in the following figures:


To reproduce the figures:
cd manif/build/examples
./se2_interpolation 9 0 40 > se2_interp_slerp.csv
./se2_interpolation 9 1 40 > se2_interp_cubic.csv
./se2_interpolation 9 2 40 > se2_interp_cnsmooth.csv
Then open Matlab and edit the visualization script examples/scripts/plot_interpolation.m.
One should edit both the path and file_base variables.
Run the script to visualize the plot.