English | 简体中文
- 📦 开箱即用:配置式的地理图表,内置多粒度行政数据
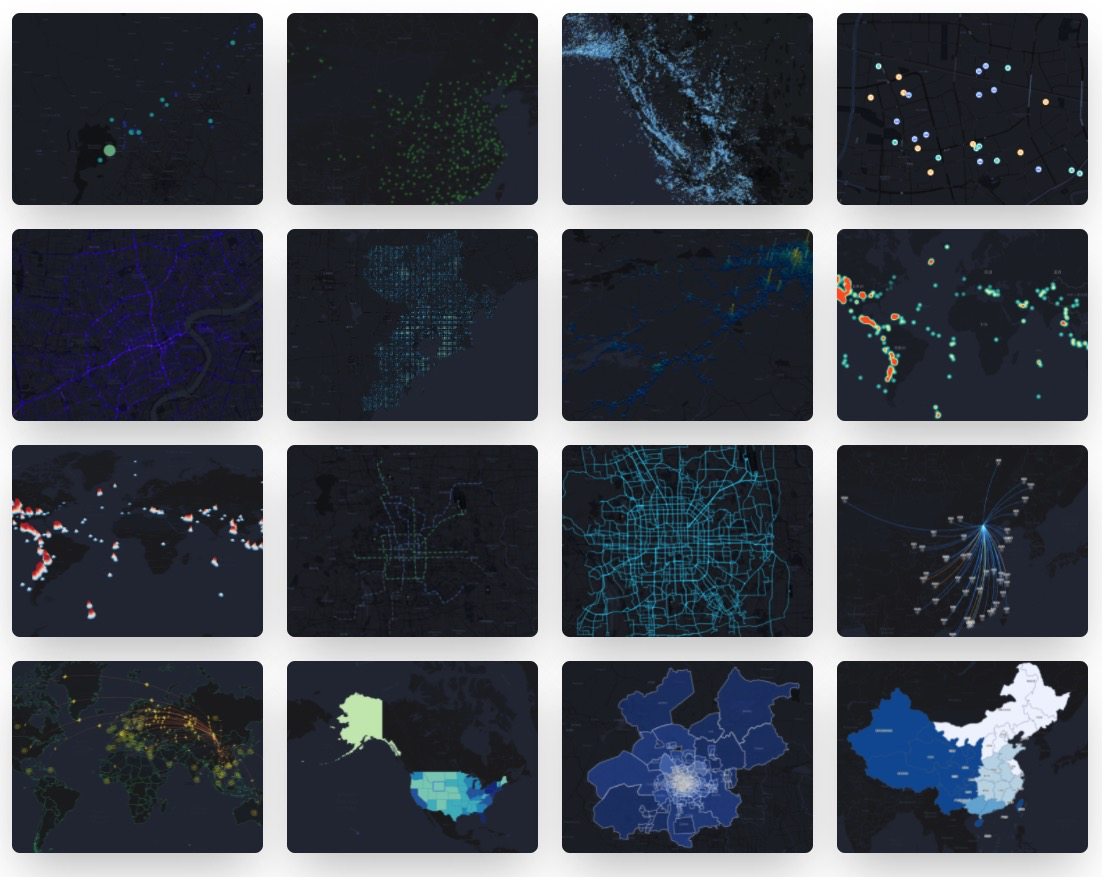
- 🚀 元素丰富:图表类型及地图组件丰富,多地图底图支持
- 💯 容易定制: 数据驱动,从数到形,支持多图层及多图表层叠
- 🌱 动态交互:图表交互能力强、支持 2/3D 视角、提供命令式动态交互 API
$ npm install @antv/l7 @antv/l7plot
<div id="container"></div>import { Dot } from '@antv/l7plot';
const data = [
{ lng: 103.715, lat: 31.211, depth: 10, mag: 5.8, title: 'M 5.8 - eastern Sichuan, China' },
{ lng: 104.682, lat: 31.342, depth: 10, mag: 5.7, title: 'M 5.7 - eastern Sichuan, China' },
// ...
];
const dot = new Dot('container', {
map: {
type: 'mapbox',
style: 'light',
center: [103.447303, 31.753574],
zoom: 7,
},
autoFit: true,
source: {
data: data,
parser: { type: 'json', x: 'lng', y: 'lat' },
},
color: {
field: 'mag',
value: ['#82cf9c', '#10b3b0', '#2033ab'],
scale: { type: 'quantize' },
},
size: {
field: 'mag',
value: ({ mag }) => (mag - 4.3) * 10,
},
state: { active: true },
scale: { position: 'bottomright' },
legend: { position: 'bottomleft' },
tooltip: {
items: ['title', 'mag', 'depth'],
},
});# 全局安装 yarn
$ npm install yarn -g
# 安装项目依赖
$ yarn bootstrap
# 实时编译各 package 并启动 storybook
$ yarn dev
# 运行网站
$ yarn dev-website
# 运行单元测试
$ yarn test
# 打开 electron 运行单元测试,并监听测试文件
$ yarn test-live如果您在使用的过程中碰到问题,可以先通过 issues 看看有没有类似的 bug 或者建议。
如需提交代码,请遵从我们的贡献指南。
MIT