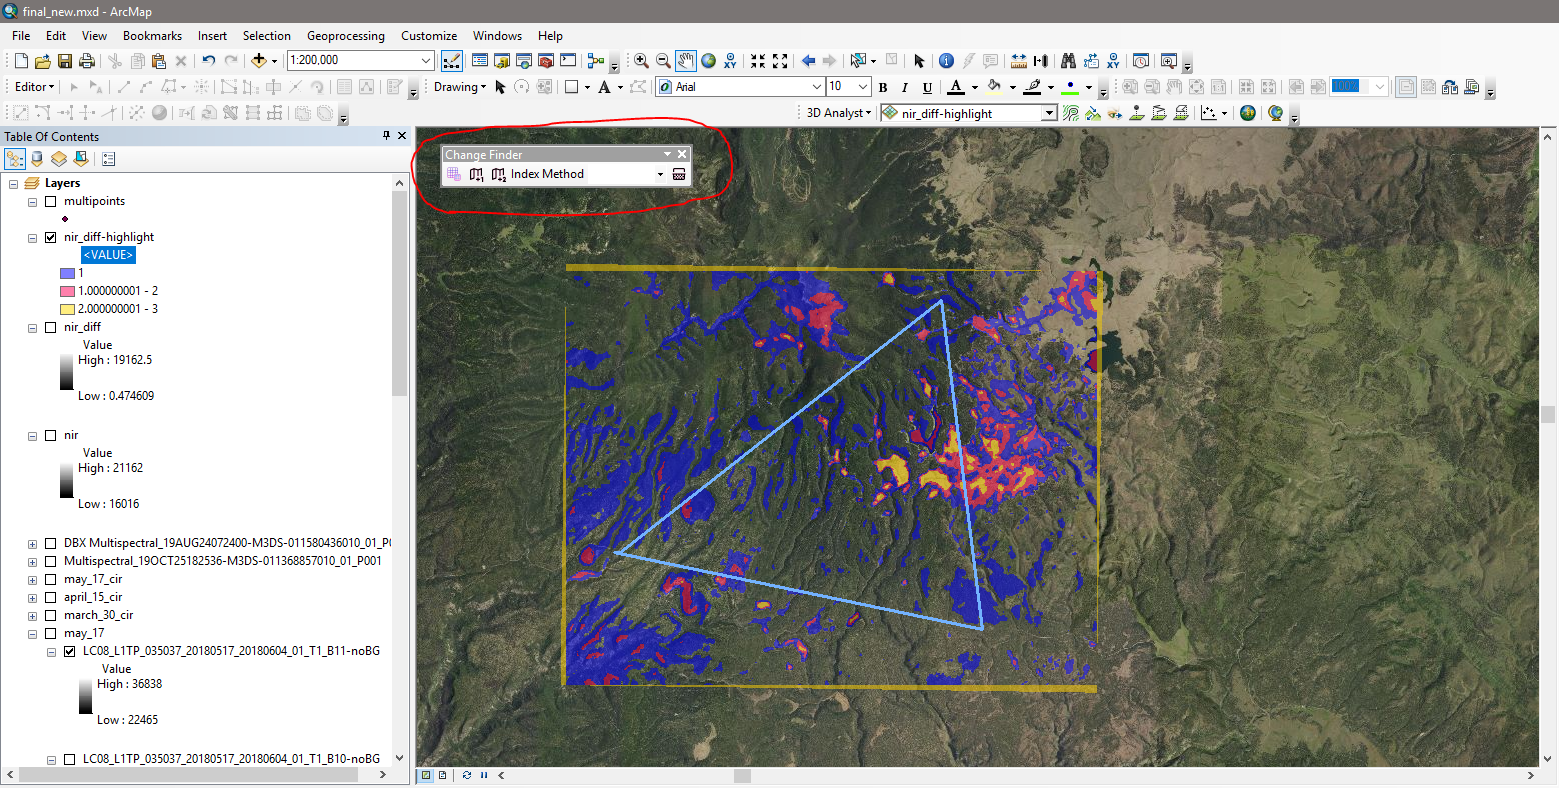
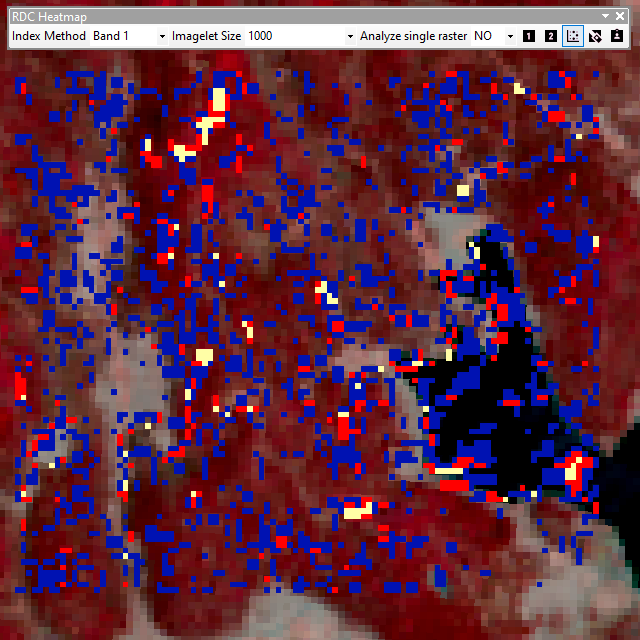
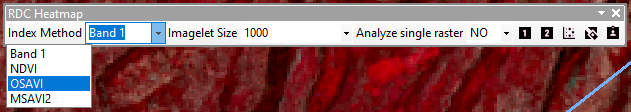
This add-in for ArcGIS allows a user to quickly create a heatmap of significant changes between two raster datasets based on relative difference in contrast (r.d.c.). NDVI, OSAVI, and MSAVI2 index methods are selectable as processing options (Band 1, NDVI, OSAI, MSAVI2) before calculating r.d.c. Cells with significant changes are classified in an output raster based on how many standard deviations away from mean r.d.c. each cell's r.d.c. is between the two overlapping input rasters. A single raster may also be highlighted based on its band 1 values' standard deviation distance away from band 1 mean to reveal outliers.
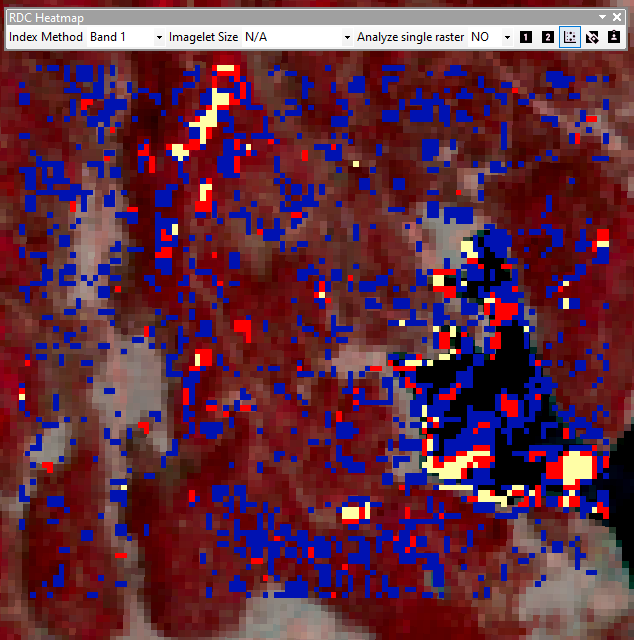
Analysis of areas may be set to an entire area or localized by dividing the greater area into an adjustable fishnet (ex: 3x3 below).
Additionally, there is a utility tool in this add-in to strip backgrounds from rasters and replace the 0 value backgrounds with NODATA values to assist with accurate calculations and reduce visual clutter.
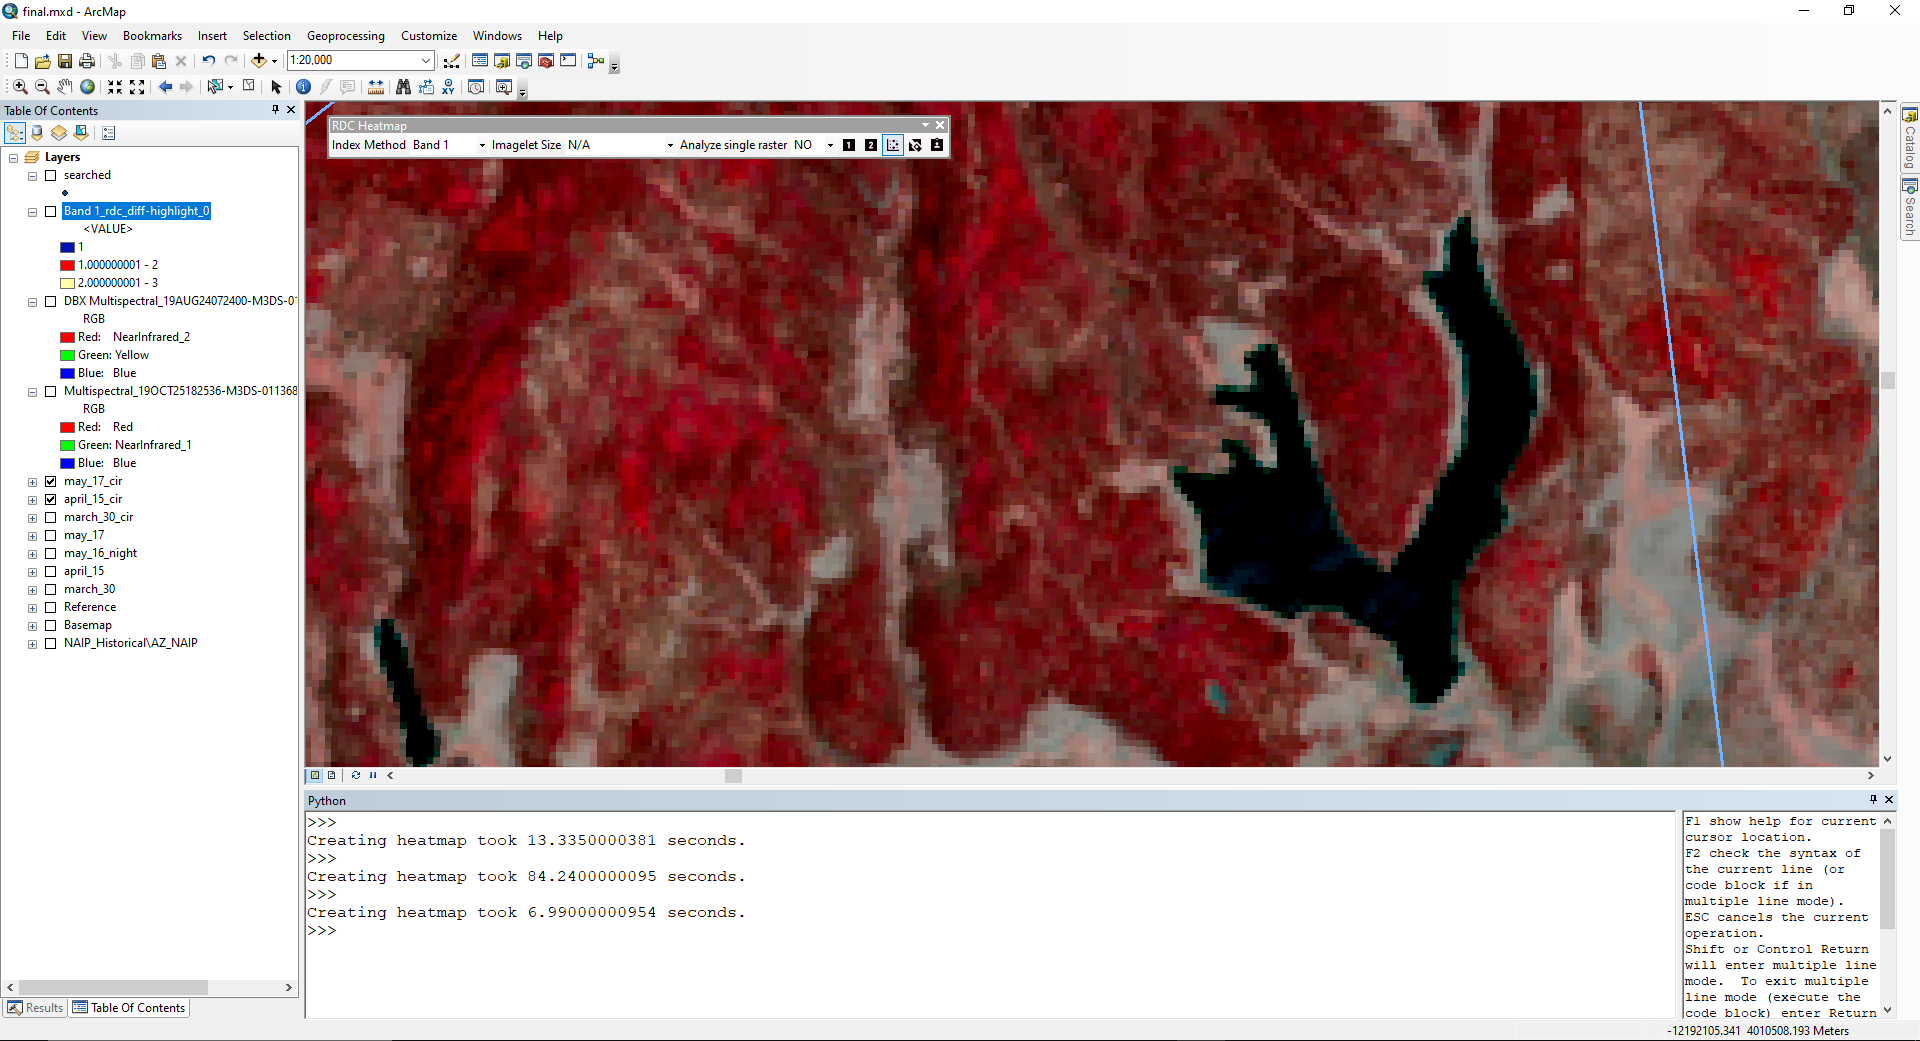
The difference between a whole area and fishnet analysis and heatmap is displayed below. The lake's differences in values are smoothed out when analyis is divided into imagelets (1000m x 1000m).
On May 6, 2018, about 1338 mountain standard time, a Grumman TBM-3E airplane, N337VT, is presumed to have impacted terrain following the bailout of the pilot and passenger due to a partial loss of engine power about 8 miles southwest of Mount Baldy, on the Fort Apache Reservation, Arizona. --NSTB event ANC18LA034
The airplane is assumed to still be intact and somewhere in the mountains of Fort Apache Reservation, Arizona. The owner has asked for public help in locating the plane. Multi-spectral imaging using modern satellites may be able to assist with this search as the potential crash area upwards of 30,000 acres is much too great to manually search at low cost.
The sample_data folder contains May 2018 day and night Landsat 8 Band 11 (TIRS 2) [thermal] data in Apache County, AZ clipped to the probable crash site of N337VT. If the plane wreckage was significantly exposed to Landsat 8 and Landsat 8 thermal resolution (currently 100m x 100m) was sufficiently high, we may see the plane highlighted due to heating and cooling differences.
-
Clone this repository.
-
Add add-in by double cicking the
change_finder.esriaddinfile inside thechange-finderfolder. -
Restart ArcMap.
-
Enable the Relative Difference Contrast Heatmap add-in under Customize > Add-In Manager.
-
Enable the RDC Heatmap toolbar under Customize > Toolbars.
-
Move
highlight_heatmap.lyrto the same directory as your project file. RDC Heapmap is set to look at relative root for a layer file to apply heatmap (1-2, 2-3, 3+) symbology from.
This add-in requires a Spatial Analyst license due to raster calculations.
The only required data are two overlapping raster images for the same geographic area.
-
Select an index method to use and define the size of the rectangle area to apply the index method to.
-
Set imagelet size if you want to create localized heatmaps by subdividing the extent into a fishnet.
-
If you want to create a heatmap highlighting outliers of a single raster select YES for Analyze single raster.
-
Select two raster layers to compare one at a time and click the appropriate "Select raster #" button to save your selection. For chronological change, raster 1 should be the earlier data. Make sure the rasters have bands 1 and/or 2 depending on your previous selections.
-
Click heatmap button and draw a rectangle around the extent you want to generate a heatmap for.
The output dataset will be a raster containing the area cells' relative difference in contrasts and a raster classifying cells in the area based on how many standard deviations away from mean r.d.c. each cell's r.d.c. is.
To strip backgrounds from rasters with 0 value backgrounds, select the raster and click the remove background tool. The new raster will be saved to the same directory as the original raster with -noBG appended to the filename.
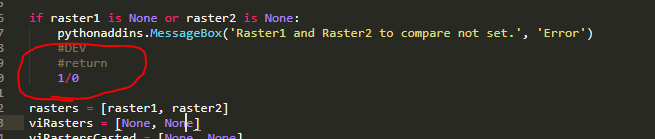
oneRun.py is a development file used to test code changes in a single step the ArcMap Python interpreter. Returns are substituted with 1/0 to simulate code from within a function while in the interpreter.
This add-in was tested in ArcMap 10.7.1
ArcGIS Desktop Python Add-In Wizard to assist with editting add-in configuration (config.xml) is available here and it is also included in the Resources folder.