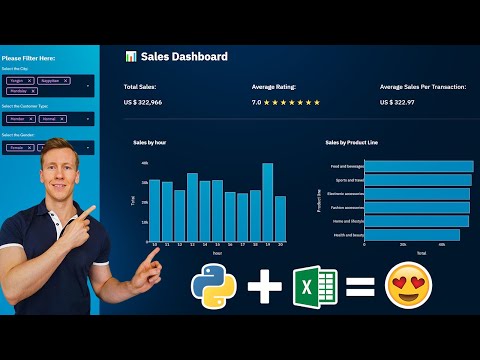
Sales Dashboard built-in Python and the Streamlit library to visualize Excel data.
# vanilla terminal
streamlit run app.py

# quit
ctrl-cSales Dashboard: https://www.salesdashboard.pythonandvba.com/

I've developed some handy Excel add-ins that you might find useful:
- 📊 Dashboard Add-in: Easily create interactive and visually appealing dashboards.
- 🎨 Cartoon Charts Add-In: Create engaging and fun cartoon-style charts.
- 🤪 Emoji Add-in: Add a touch of fun to your spreadsheets with emojis.
- 🛠️ MyToolBelt Add-in: A versatile toolbelt for Excel, featuring:
- Creation of Pandas DataFrames and Jupyter Notebooks from Excel ranges
- ChatGPT integration for advanced data analysis
- And much more!
- 📺 YouTube: CodingIsFun
- 🌐 Website: PythonAndVBA
- 💬 Discord: Join our Community
- 💼 LinkedIn: Sven Bosau
- 📸 Instagram: Follow me
Love my content and want to show appreciation? Why not buy me a coffee to fuel my creative engine? Your support means the world to me! 😊

Got some thoughts or suggestions? Don't hesitate to reach out to me at [email protected]. I'd love to hear from you! 💡