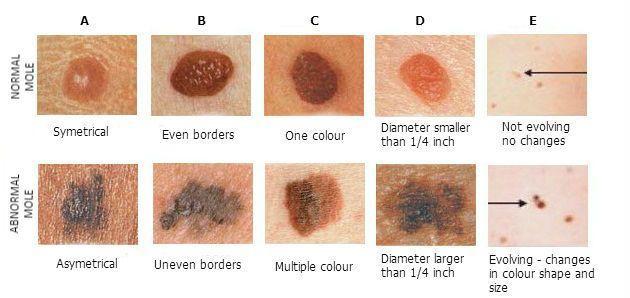
The aim of this competition was to correctly identify the likeliness that images of skin lesions of patients represent melanoma.
Skin cancer is the most prevalent type of cancer. Melanoma, specifically, is responsible for 75% of skin cancer deaths, despite being the least common skin cancer. The American Cancer Society estimates over 100,000 new melanoma cases will be diagnosed in 2020. As with other cancers, early and accurate detection-potentially aided by data science-could make treatment more effective.
Image analysis tools that automate the diagnosis of melanoma would improve dermatologists' diagnostic accuracy. Better detection of melanoma has the opportunity to positively impact millions of people.
The submissions were evaluated on area under the ROC curve between the predicted probability and the observed target.
A lot of Object Detection models were tried and tested after Extrapolatory Data Analysis and applying Image Augmentations namely ResNeXt, EfficientNet-b0, EfficientNet-b3, EfficientNet-b5, EfficientNet-b6 and ResNet.
EfficientNet-b5 provided the best CV scores.
But due to reasons like :
- The number of Malignant Melanomas in test data (10982 images) being in the 2%-3% range i.e. only top 220-330 images were important and rest are benign lesions.
- Understandibibity of false positives according to the AUC metric.
Therefore a solo model couldn't achieve a high LB score and an ensemble had to be used.
According to each image name a Linear Regressor was fitted and higher future score was predicted accordingly.
According to each image name a Polynomial Regressor was fitted and similarly a higher future score was made to be predicted.
According to each image name if all the models agree that it's above a certain threshold (cutoff_LOW) then it predicts the maximum, if they predict its below a certain threshold (cutoff_HIGH) then predict the minimum, else predict the score of the then considered best model's prediction.
The area under the ROC curve is sensitive to the distribution of predictions. So according to each target prediction vector they were first ranked and then blended in the form of x1w1 + x2w2 + x3w3 .... + xnwn.
The target metric of this competition was based on ranks rather than on actual values , therfore as long as the order of the values was fixed, the metric would stay the same.
Only the rank of the predictions matters not the actual values, so two different models that give the same score could actually output completely different values. They are not even required to be in (0, 1) range. Hence by preprocessing using rankdata() from scipy.stats the LB scores may increase , but its dependent on the model's biasness.
- Whenever a prediction was made and score was achieved, it was fed back into the dataframe as a new column, thereby increasing the data to provide a better prediction.
- https://www.kaggle.com/solomonk/minmax-ensemble-0-9526-lb
- https://www.kaggle.com/c/siim-isic-melanoma-classification/discussion/161497
- https://www.kaggle.com/niteshx2/improve-blending-using-rankdata/data?
- Data-melanoma contains files of the individual ensemble predictions.
- data-melanoma-globbed.csv contains the globbed predictions to feed into the ensembling techniques.
- Ensembles_melanoma.ipynb is the python notebook containing the ensemble methods.