This component, using d3js API, draw animated bubbles chart with gravity

This is a visual component that draw a chart with centered gravity based on d3 API library.
Based on Jim Vallandingham Blog Post, Obama’s 2013 Budget Proposal and Automobile Force, Gravity Bubbles it's a component that draw a collection of bubbles, and allow the user to compare data attributes by color and size.
The main characteristic is the "gravity" to center, and hence its name.

Also the component include 3 views:
- "all" view with unique center in center of chart
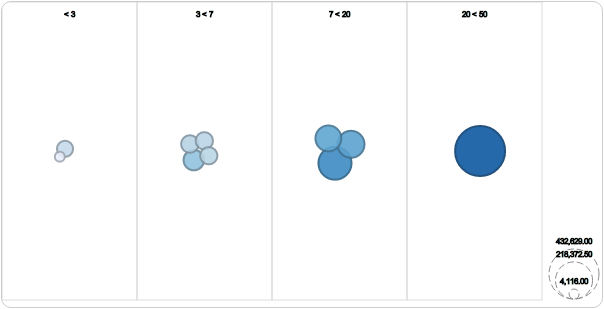
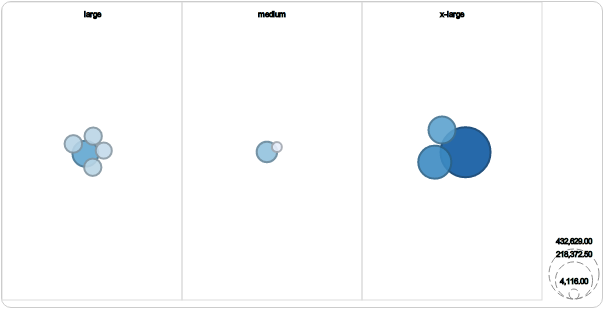
- "color" view, that are bubbles grouped by color fences, as vertical bands.
- A free group that is a name of property of data that can be used to group data, (such as country, category, contact id, etc).
###Some features
- Tooltip templated configuration
- Label templated configuration
- Animated transitions
- Size comparizons
- Group data capability
- Easy color schema changes
- Adaptable data legend
- All items are visibles, including negatives and smallest data
####Default:
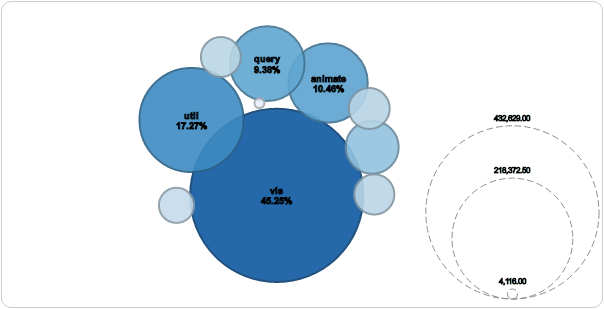
####Flare Example Based on common tree data "flare", and using D3js library, this example shows bubbles grouped in center (force), like earth gravity, with distinct sizes and colors, you can dive into data hierarchy.
####Evolution Example Based on D3js library, this example shows the evolution of bubbles through time, loading data in asynchronous form, under demand. Or you can push play to automate the action.
####Martian Example(Thanks to headwins) In the year 2030, we face a new form of global conscription. Since we've ruined our planet, NATO has ordered the remaining population to board the fleet of Dragon class drop ships headed for that distant red rock in the sky which we'll have to now call home. Many are seeking asylum status in Southeast Asia to avoid ruining another planet.
####Gravity Label This fiddle example shows how to configure the component for adaptable label to enabled space
####Colors Changes: It's easy to change bubble colors, setting points and colors arrays.
If you want to see it in action, go to jsfiddle that explain some concepts of use, and show how to change some properties. Or if you want to see a more complex use, please go to gravity-bubbles Currently I'm documenting the project, and please, contact me if you want to help or discovered some issue. To start using it, you must to download this proyect, and solve next dependencies.
Dependencies:
- jquery
- d3 api
- linear-gauge (only for examples)
- jquery-ui (only for examples)
You can pass these options to the initialize function to set a custom look and feel for the plugin.
| Property (Type) | Default | Description |
|---|---|---|
| width | Calculated container width | It's the external width of component. Doesn't include left and right margins |
| height | 40 | It's the external height of component. Doesn't include top and bottom margins |
| points | [0, 25, 50, 75, 100] | They are thresholds of color changes |
| colors | ["#ff0000", "#ffa300", "#ffe100", "#fffa00", "#1f6f02"] | They are the distinct colors that change on the thresholds |
| data | This node is an object that receives parameter exclusive for data | |
| data\label | none | It has three optional parameter, they are template,formatter and autofit.
|
| data\tooltip | none | It has two optional parameter, they are template and formatter |
| data\sizeById | size | Indicates property to be used to radius of bubble |
| data\colorById | perc | Indicates property to be used to colorize bubbles |
| Selector | Description | Is in use? | Observations |
|---|---|---|---|
| .gravity-container | It's just to hold styles asociated with this chart | Yes | Change it to add borders, background, and so on |
| .gravity-container .bubble | This class holds basic properties to bubbles, such as border and opacity | Yes | Overwrite to change. Don't all properties related with color, are changed by component |
| .gravity-container .bubble:hover | This class holds basic properties to bubbles, when user hover it | Yes | Overwrite to change. |
| .gravity-container .bubble.drilldown | This class holds basic properties to bubbles, when user hover it | No | Overwrite to change. |
| .gravity-container .group | This class is for group background | Yes | Overwrite to change or add border or colors. |
| .gravity-container rect.group.multiple | This class is for group background when is mutiple type | No? | Overwrite to change or add border or colors. |
| .gravity-container .group-text | This class is to define properties of group text, such as font, color and so on | Yes | Overwrite to change or add stroke or font size. |
| .gravity-container .legend-circle | Style for legend at right that shows information about drawed bubbles (max, min) | Yes | Overwrite to change stroke or change dash array. |
| .gravity-container .legend-text | Style for text of legend | Yes | Overwrite to change stroke or font. |
| .gravity-container text.label | Style for labels inside bubble | Yes | Overwrite to change stroke or font. |
| .gravity-container .tooltip | This style define tooltip format (when hovering bubble) | Yes | Overwrite to change size, background color, font, etc. |
| .gravity-container .tooltip .title | This style customize title of tooltip | Yes | Overwrite to change size, background color, font, etc. |
| .gravity-container .tooltip .name | This style customize title of tooltip | Yes | Overwrite to change size, background color, font, etc. |
When the user click on bubble, a click is fired to comunicate that values have been clicked. It can be used to do a drilldown
| Event | Property | Value |
|---|---|---|
| click | d | Data Clicked |
$(function() {
    // instantiate the plugin

    chart = new GravityBubbles({
                id: "vis",
                sizeById: "size",
                colorById: "perc",
                data: {
                    tooltip: function(d) {
                        //Parameter d is clicked data
                        //You can return a string template
                        return "<b>Name:</b>{name}<br><b>Size:</b> {size}<br><b>Size of Total:</b> {perc}%";
                    },
                    label: {
                        //{name} Indicates that will try to show property value called name
                        template : "{name}\n{perc}%",
                        //Force the label to fill bubble and scale it
                        autofit: true
                    },

                    onclick: function(d) {
                        //Parameter d is clicked data
                    }
                }
            });
});Now project supports testing and run all tests under tests folder. Solving dependencies with karma and jasmine you can run tests with.
grunt test
Native support
- Chrome
- Safari
- FireFox
- Opera
- Internet Explorer 9+
Support for Internet Explorer 9.
Copyright (c) 2016 triad, contributors. Released under the GPL-3.0 license
Special Thanks to contributors: