-
Notifications
You must be signed in to change notification settings - Fork 19
Data Overview
ED BMSdiag will present the collected data in sections for better readability. Here you will get an overview of the readouts.
When data is collected normally you get a status message like this "Reading data........". Each dot stands for a successful measurement.
-
Time and Odometer
Time [hh:mm]: 08:20, ODO : 19221 km
The current time from the multifunction display and the Odometer reading in km. -
General Battery Data
SOC : 100.0 %, realSOC: 96.2 %
Battery State of Charge. SOC will display the value of the dashboard gauge. realSOC is the internal value of the BMSHV : 385.8 V, -1.25 A, -0.48 kW
High Voltage readings of the battery. Total voltage, the current and the calculated power.The amps readout is more precise in the bms submenu, when the data from the BMS is used.
LV : 13.0 VOn-board voltage of the 12V-battery and the DC/DC (while car is activated). -
Cellvoltages from the BMS
CV mean : 4144 mV, dV = 53 mV
CV min : 4113 mV
CV max : 4166 mV
Cell voltages as mean, minimum and maximum value.dVis the delta between min and max.OCVtimer: 1142 s
Time to achive Open Cell Voltage state of the battery.
The value is depending on the mean cell temperature and is continuously calculated - it will not count down. The BMS will use this value to calculate the predicted OCV state of the cells to get a baseline for balancing or capacity measurement.
-
Capacity Measurement of the BMS
Last measurement : 0 day(s)
Measurement estimation: 0.818
Actual estimation : 0.810
The BMS does monitor the capacity of all individual cells during charge. It will show the number of days since the last successful measurement.
0 day(s)indicate refreshed values. This counter is reset by the BMS itself and can not manually be altered.
The quality of the measurement will be estimated. Values >0.8 indicate a reliable result. The quality will be improved by a large ∆SOC - so beginning a charge from 20% to a full 100% will get an estimate of about 0.85 .CAP mean: 18472 As/10, 51.3 Ah
CAP min : 17881 As/10, 49.7 Ah
CAP max : 18958 As/10, 52.7 Ah
Beside the individual data the BMS will calculate a capacity estimate for a reference temperature of about 25 °C. These values do not indicate the real charge! -
High Voltage Contactor
HV contactor state ON, low current: 12 s
cycles left : 295902
of max. cycles: 300000
The car has a special high voltage, high current contactor to disconnect from the battery system when it is inactive. Here you get the cycles of the contactor left (and the possible count - by design). The ON / OFF / Low Current state is monitored and indicated by a counter in seconds.In addition the isolation on the DC circuit will be measured:
DC isolation : 5730 kOhm, NO FAULT. A fault will be reported by values under 1000 kOhm.A vehicle with 22kW fast charger will report isolation values of about 6000 kOhm. See technical specification of BRUSA NLG6! When the standard OLB is present you will get about 50000 kOhm = 50 MOhm isolation under normal conditions.
-
Battery Temperatures
Temperatures Battery-Unit /degC:
module 1: 29.8, 36.5, 31.3
module 2: 30.8, 37.8, 31.6
module 3: 30.2, 35.7, 30.3
mean : 32.7, min : 29.8, max : 37.9
coolant : 27.7
Monitor the temperature of the battery system. Each Module has three thermal sensors. When the middle sensor is about 8 to 10 °C higher as the two on the edge, the module is probably balancing the cells. By design the active cooling system will keep the temperature below 45 °C. -
Individual Cell Statistics
Here you will find the real measurements of the BMS (done during a charge). A good battery will have only one cell with a slightly lower voltage than the maximum value (about
dV = 25 mV). Please also monitor the standard deviations. It will give you an idea about the scattering of the voltages around the mean value. A standard deviation ofs < 5 mVor lower is good.CV mean : 3763 mV, dV = 28 mV, s = 4.09 mV
CV min : 3748 mV, # 91
CV max : 3776 mV, # 66Those statistics will also be calculated for the cell capacities:
CAP mean: 19292 As/10, 53.6 Ah
CAP min : 18584 As/10, 51.6 Ah, # 62
CAP max : 19801 As/10, 55.0 Ah, # 91The cell with the minimal capacity will limit the usable energy of the complete battery. The cells are connected in series and the weakest cell will run down first.
So 51.6 Ah is the minimal capacity of the pack , measured on cell #62.
-
Voltage Distribution as Box Plot
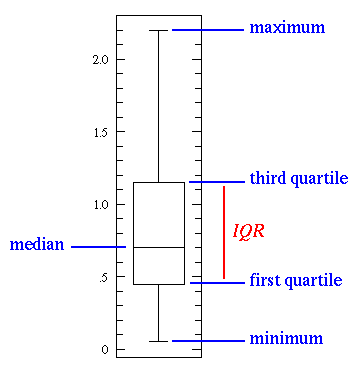
The voltage distribution of the battery pack is not evenly distributed. The standard deviation will not represent a good indicator when outliners are present. A box plot is much more effective to visualize the data.
Between the minimum and the maximum cell voltage the quartiles Q1 (p25), the median (p50) and the Q3 (p75) values are calculated and displayed:
Example of a very well balanced battery:
Voltage Distribution (dV= 27 mV):
*---------------------------------->-[]-*
4141   02 > [4166; 4166; 4167] < 00  4168
min         [p25; median; p75]        max
Example of a badly balanced battery:
Voltage Distribution (dV= 101 mV):
*-----------------[========|======]-----*
3978   00 > [4024; 4048; 4064] < 00  4079
min         [p25; median; p75]        max
Within the Q1
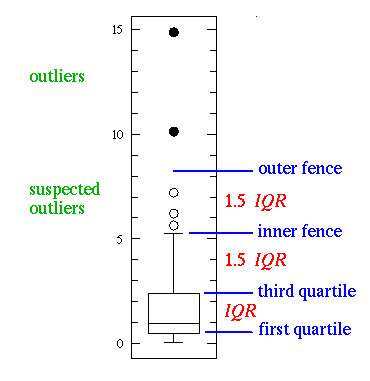
[and Q3]quartiles are 50% of the voltage values. In this interval the median|will be displayed. The upper and lower whiskers-represent the lower and upper 25% of the data including outliners, that are only counted, but not visualized in the graph.Outliners are defined to be outside the 3 times IQR interval (IQR = Q3 - Q1). Suspected outliners are outside the 1.5 times IQR interval. This range is used to calculate the number of outliers under and above in the whiskers, excluding the minimum and maximum values.
Example for outliners evaluation:
Voltage Distribution (dV= 31 mV):
*-------------------->-------[==|=]-----*
3500   08 > [3523; 3525; 3527] < 00  3531
min         [p25; median; p75]        max
The lower
>and upper<interval is visualized when it´s in the range of the graph. Only the count of voltage values (here08in the lower andnonein the upper) is displayed, due to the low resolution of the ASCII-scale (40 points are used). So in the example eight voltages are off-value in the lower whisker and are suspectable outliners that are not very well in the range of the IQR window.For further information about box plots see:
-
Voltage and Current Readings
User selected : 8 A
Cable maximum : 20 A
Chargingpoint : 8 A
List of possible currents (the selected current in the multifunction display, the maximum current the cable is capable of and the maximum current the chargepoint will deliver.)AC L1: 226.0 V, 8.0 A
AC L2: 0.0 V, 6.6 A
AC L3: 0.0 V, 9.1 A
Data of the three phases from the mains connection.The example shows a single phase operation. The currents reported for L2 and L3 are no fault. The charger has a power correction feature and those currents indicate proper operation.
DC HV: 335.6 V, 4.6 A
Voltage and current reported in DC circuit (battery and DC/DC).DC LV: 13.9 V
On board voltage of 12V-system (measured by charger). -
Temperatures
Temperatures Charger-Unit /degC:
Reported : 23
Cooling plate : 23
Inlet socket : 24
The charger will report a mean temperature of the unit. In addition the liquid cooling loop and the inlet socket will also be monitored.Internal values:23, 23, 23, 23, 23, 23, 23, 23
Get all readings from the internal measurements.
The charger will only report plausible values if actively charging the battery!
-
Voltage and Current Readings
User selected : 16 A
Cable maximum : 20 A
List of possible currents (the selected current in the multifunction display, the maximum current the cable is capable of.)AC L1: 226.1 V, 15.8 A
Single phase data of the mains connection.DC HV: 351.5 V, 9.3 A
Voltage and current reported in DC circuit (battery and DC/DC).DC LV: 14.0 V
On board voltage of 12V-system (measured by charger). -
Temperatures
Temperatures Charger-Unit /degC:
Reported : 42
Cooling plate : 38
Inlet socket : 33
The charger will report a mean temperature of the unit. In addition the liquid cooling loop and the inlet socket will also be monitored.
With Type1 socket (US) no valid socket temperature is reported.
-
Main Cooling Loop
Temperature : 30.7 degCCooling Pump : 64.3 %, 32 degC
: 13.6 V, 1.4 A
Readout of the cooling loop pump. Get the status like RPM (in % of maximum), the reported temperature and the voltage and amps used by the pump.OTR:
Cooling Pump : 836 h
Battery heater: 32 h, OFF
The control unit will keep an Operation Time Record of compontets with wear. Find the values of the cooling pump, the battery heater (used to heat up the cooling loop under low temperatures) and the operating time of the vaccum pump for the break:Vaccum Pump : 18.006 hPressure 1, 2 : -619 mbar, -622 mbar
Pressure reported by two sensors in mbar of the breake-system.

