Packet Drops Monitoring
- Introduction
- Monitoring Software Originated Drops
- Monitoring Hardware Originated Drops
- Further Resources
The Linux kernel's data path can be quite complex and may involve interactions between multiple different modules. Consequently, packets traversing this data path can be dropped for a variety of reasons. Being able to monitor these packet drops and understand where and why they occurred is invaluable when trying to root cause a problem.
When the data path is offloaded using one of the ASICs from the Spectrum family, packets are not dropped by the kernel, but rather by the ASIC itself.
This page explains how to monitor packet drops that occur in either the software or hardware data path.
| Kernel Version | |
|---|---|
| 5.4 | Layer 2 drops |
| 5.5 | Layer 3 drops and exceptions |
| 5.6 | Tunnel drops and exceptions |
| 5.7 | ACL drops, Packet trap policers |
| 5.9 | Monitoring of early-dropped packets |
| 5.16 | Mirroring of ECN-marked packets |
Note: devlink-trap support is available in iproute2 version 5.4
and onwards. Please refer to these sections for instructions
on how to compile the kernel and iproute2 from source.
Packets (also called socket buffers) are dropped by the Linux kernel by
invoking the kfree_skb() function. This is in contrast to packets
that are freed as part of normal operation by the consume_skb()
function.
The drop_monitor kernel module can be used to trace the
kfree_skb() function and send netlink notifications to user space
about dropped packets. The module is available in kernels compiled with
NET_DROP_MONITOR enabled.
The DropWatch user space utility can be used to interact with the
drop_monitor kernel module over netlink. Historically, the kernel
would only send periodic notifications (also called alerts) to user
space about dropped packets. These notifications include the call site
from which kfree_skb() was invoked and the number of invocations in
the last interval.
In kernel 5.4 another mode of operation was added, in which the kernel sends the dropped packets themselves to user space along with relevant metadata.
The two modes of operation are described below.
Note: The DropWatch changes that add the second mode of operation have yet to be included in an official release. Therefore, for the time being, it is recommended to install DropWatch directly from source.
To monitor packet drops in this mode using DropWatch, run:
$ dropwatch -l kas
Initalizing kallsyms db
dropwatch> start
Enabling monitoring...
Kernel monitoring activated.
Issue Ctrl-C to stop monitoring
1 drops at ip6_mc_input+235 (0xffffffff8286d295) [software]
1 drops at br_stp_rcv+ff (0xffffffff828c2d4f) [software]
To monitor packet drops in this mode using DropWatch, run:
dropwatch> set alertmode packet
Setting alert mode
Alert mode successfully set
dropwatch> start
Enabling monitoring...
Kernel monitoring activated.
Issue Ctrl-C to stop monitoring
drop at: ip6_mc_input+0x235/0x2a0 (0xffffffff8286d295)
origin: software
input port ifindex: 4
timestamp: Sun Aug 25 18:55:04 2019 299272815 nsec
protocol: 0x86dd
length: 167
original length: 167

drop at: ip6_mc_input+0x235/0x2a0 (0xffffffff8286d295)
origin: software
input port ifindex: 4
timestamp: Sun Aug 25 18:55:05 2019 501599210 nsec
protocol: 0x86dd
length: 114
original length: 114
It is possible to have the kernel truncate the dropped packets to a specified length before notifying them to user space. For example, in case only the first 96 bytes are of interest, run:
dropwatch> set trunc 96
Setting truncation length to 96
Truncation length successfully set
dropwatch> start
Enabling monitoring...
Kernel monitoring activated.
Issue Ctrl-C to stop monitoring
drop at: br_stp_rcv+0xff/0x2eb (0xffffffff828c2d4f)
origin: software
input port ifindex: 4
timestamp: Sun Aug 25 18:55:55 2019 956117078 nsec
protocol: 0x4
length: 96
original length: 119
In order to avoid expensive operations in the context in which packets
are dropped, the drop_monitor kernel module clones the dropped packets
and queues them on a per-CPU list which is later processed in process
context. By default, the length of this queue is bound at 1,000 packets
in order to avoid exhausting the system's memory. To monitor the number
of packets that were dropped due to this limit, run:
dropwatch> stats
Getting statistics
Software statistics:
Tail dropped: 0
Hardware statistics:
Tail dropped: 0
To change the limit, run:
dropwatch> set queue 100
Setting queue length to 100
Queue length successfully set
The current configuration can be queried from the kernel by the following command:
dropwatch> show
Getting existing configuration
Alert mode: Packet
Truncation length: 96
Queue length: 100
Each dropped packet is encapsulated in a netlink packet that also
encodes various metadata about the dropped packet such as drop location
and timestamp. It is possible to dissect these netlink packets using
Wireshark or its terminal equivalent, tshark.
Packets can be captured using dwdump which is part of the
DropWatch utility. For example:
$ dwdump -w drops.pcap
The packets can be later imported into Wireshark. Alternatively, it is
possible to display and filter the currently dropped packets using
tshark. For example, to filter dropped IPv6 packets with UDP port 547,
run:
$ dwdump | tshark -Y 'eth.type==0x86dd && udp.dstport==547' -O net_dm -r -
It is also possible to filter on specific fields in the encapsulating netlink packet. For example, to filter dropped packets received from a particular netdev, run:
$ dwdump | tshark -Y 'net_dm.port.netdev_index==5' -O net_dm -r -
To filter packets that were dropped in the IPv6 stack, run:
$ dwdump | tshark -Y 'net_dm.symbol contains "ip6"' -O net_dm -r -
To list the fields exposed by the drop monitor dissector, run:
$ tshark -G fields | grep net_dm
P       Linux net_dm (network drop monitor) protocol    net_dm
...
F       Timestamp       net_dm.timestamp        FT_ABSOLUTE_TIME        net_dm          0x0
F       Protocol        net_dm.proto    FT_UINT16       net_dm  BASE_HEX        0x0
F       Truncation length       net_dm.trunc_len        FT_UINT32       net_dm  BASE_DEC        0x0
F       Original length net_dm.orig_len FT_UINT32       net_dm  BASE_DEC        0x0
F       Queue length    net_dm.queue_len        FT_UINT32       net_dm  BASE_DEC        0x0
F       Attribute type  net_dm.stats.attr_type  FT_UINT16       net_dm  BASE_DEC        0x3fff
F       Packet origin   net_dm.origin   FT_UINT16       net_dm  BASE_DEC        0x0
F       Hardware trap group name        net_dm.hw_trap_group_name       FT_STRINGZ      net_dm          0x0
F       Hardware trap name      net_dm.hw_trap_name     FT_STRINGZ      net_dm          0x0
F       Hardware trap count     net_dm.hw_trap_count    FT_UINT32       net_dm  BASE_DEC        0x0
...
Note: To understand if your Wireshark version includes the
dissector, check the output of tshark -G protocols | grep net_dm. In
case the dissector is included, the output should be: Linux net_dm (network drop monitor) protocol net_dm net_dm. To install Wireshark
from source, please refer to the Wireshark documentation.
When the data path is offloaded, packets are both forwarded and dropped by the ASIC. This means that the kernel has no visibility into these packet drops, which makes it difficult to debug various problems.
Using devlink-trap it is possible to instruct the ASIC to pass (trap)
dropped packets to the CPU. To list the various drop reasons that can be
reported, run:
$ devlink trap show
pci/0000:01:00.0:
  name source_mac_is_multicast type drop generic true action drop group l2_drops
  name vlan_tag_mismatch type drop generic true action drop group l2_drops
  name ingress_vlan_filter type drop generic true action drop group l2_drops
  name ingress_spanning_tree_filter type drop generic true action drop group l2_drops
  name port_list_is_empty type drop generic true action drop group l2_drops
  name port_loopback_filter type drop generic true action drop group l2_drops
Please refer to the kernel documentation for explanation about the
various drop reasons. By default, dropped packets are not trapped and
therefore their action is reported as drop. To instruct the device to
trap packets that are dropped due to ingress VLAN filter, change its
action to trap:
$ devlink trap set pci/0000:01:00.0 trap ingress_vlan_filter action trap
When dropped packets are trapped, they are not injected to the kernel's receive path, but instead passed to devlink, which performs packets and bytes accounting. These statistics can be queried from the kernel using the following command:
$ devlink -s trap show pci/0000:01:00.0 trap ingress_vlan_filter
pci/0000:01:00.0:
  name ingress_vlan_filter type drop generic true action trap group l2_drops
    stats:
        rx:
          bytes 541536 packets 5641
In turn, devlink passes the dropped packet to the drop_monitor kernel
module, which will report the drop to user space in case monitoring of
hardware drops is enabled. This is explained in the next section.
The ASIC is capable of handling packet rates that are several orders of magnitude higher compared to those that can be handled by the CPU.
Therefore, in order to prevent the ASIC from overwhelming the CPU, it is possible to police the trapped packets to rates that can be handled by the CPU. This is done by binding packet trap policers to packet trap groups, which are used to aggregate logically related packet traps.
The default binding is set by the driver during its initialization and can be queried using the following command:
$ devlink trap group show
pci/0000:01:00.0:
  name l2_drops generic true policer 1
  name l3_drops generic true policer 1
  name tunnel_drops generic true policer 1
  name acl_drops generic true policer 1
To change the default binding, run:
$ devlink trap group set pci/0000:01:00.0 group l2_drops policer 2
To unbind a policer use the nopolicer keyword:
$ devlink trap group set pci/0000:01:00.0 group l2_drops nopolicer
In which case the above output will become:
$ devlink trap group show
pci/0000:01:00.0:
  name l2_drops generic true
  name l3_drops generic true policer 1
  name tunnel_drops generic true policer 1
  name acl_drops generic true policer 1
To query the parameters of policer 1, run:
$ devlink trap policer show pci/0000:01:00.0 policer 1
pci/0000:01:00.0:
  policer 1 rate 10240 burst 128
To set its rate to 1,000 packets per second (pps) and burst size to 256 packets, run:
$ devlink trap policer set pci/0000:01:00.0 policer 1 rate 1000 burst 256
When trapped packets exceed the policer's rate or burst size, they are
dropped by the policer. To query the number of packets dropped by
policer 1, run:
$ devlink -s trap policer show pci/0000:01:00.0 policer 1
pci/0000:01:00.0:
  policer 1 rate 1000 burst 256
    stats:
        rx:
          dropped 365501
By default drop_monitor only monitors software drops. In case it is
desired to have drop_monitor monitor both software and hardware drops,
run:
dropwatch> set sw true
setting software drops monitoring to 1
dropwatch> set hw true
setting hardware drops monitoring to 1
In case only hardware originated drops are of interest, run:
dropwatch> set hw true
setting hardware drops monitoring to 1
dropwatch> set sw false
setting software drops monitoring to 0
The rest of the usage is identical to what was already described for software originated drops. However, unlike software originated drops, for hardware originated drops, the drop reason is reported as a string:
dropwatch> start
Enabling monitoring...
Kernel monitoring activated.
Issue Ctrl-C to stop monitoring
drop at: ingress_vlan_filter (l2_drops)
origin: hardware
input port ifindex: 9
input port name: swp3
timestamp: Mon Aug 26 20:15:33 2019 461798287 nsec
protocol: 0x8100
length: 110
original length: 110
When dropping packets using TC, one may provide a cookie value along with the drop action. The cookie will to be attached to the metadata of dropped packets.
First, insert a filter with drop action with cookie:
$ tc qdisc add dev enp0s16np1 clsact
$ tc filter add dev enp0s16np1 ingress protocol ip pref 10 flower skip_sw dst_ip 192.168.1.2 action drop cookie 3b45fa38c8
                                                                                                                ^^^^^^^^^^
Set trap ingress_flow_action_drop to trap the packets to CPU:
$ devlink trap set pci/0000:00:10.0 trap ingress_flow_action_drop action trap
Then run dropwatch to see dropped packets:
$ dropwatch
Initializing null lookup method
dropwatch> set hw true
setting hardware drops monitoring to 1
dropwatch> set alertmode packet
Setting alert mode
Alert mode successfully set
dropwatch> start
Enabling monitoring...
Kernel monitoring activated.
Issue Ctrl-C to stop monitoring
drop at: ingress_flow_action_drop (acl_drops)
origin: hardware
input port ifindex: 30
input port name: enp0s16np1
cookie: 3b45fa38c8    <<<<<<<<<<<<<<<<<<<<<<<<<<<<<<<<<<<<<<<<<<<<<<
timestamp: Fri Jan 24 17:10:53 2020 715387671 nsec
protocol: 0x800
length: 98
original length: 98
Prometheus is a popular time series database used for event monitoring and alerting. Its main component is the Prometheus server which periodically scrapes and stores time series data. The data is scraped from various exporters that export their metrics over HTTP.
Two different Prometheus exporters are described below.
Using devlink-exporter it is possible to export packets and
bytes statistics about each trap to Prometheus.
To run the exporter on the switch you wish to monitor, run:
$ ./devlink-exporter.py -l 0.0.0.0:9417
Alternatively, use a systemd service unit file:
# /etc/systemd/system/devlink-exporter.service
[Unit]
Description=devlink exporter
Documentation=man:devlink(8)
After=network.target

[Service]
Type=simple
ExecStart=/usr/local/bin/devlink-exporter.py -l 0.0.0.0:9417

[Install]
WantedBy=multi-user.target
To start the service, run:
$ systemctl start devlink-exporter
To make the configuration persistent, run:
$ systemctl enable devlink-exporter.service
When scraped by the Prometheus server, the exporter will query the statistics from the kernel and pass them over HTTP to the server.
Grafana can then be used to visualize the information:
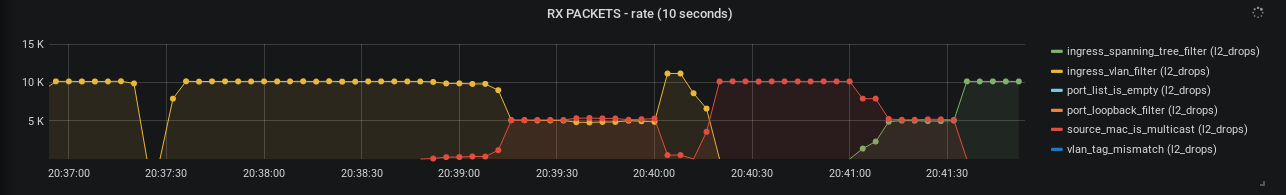
While devlink-exporter can export packets and bytes statistics,
sometimes more fine-grained statistics are required. For example, in
case per-{flow, trap} statistics are required, it is possible to use
trapagg-exporter as described here.
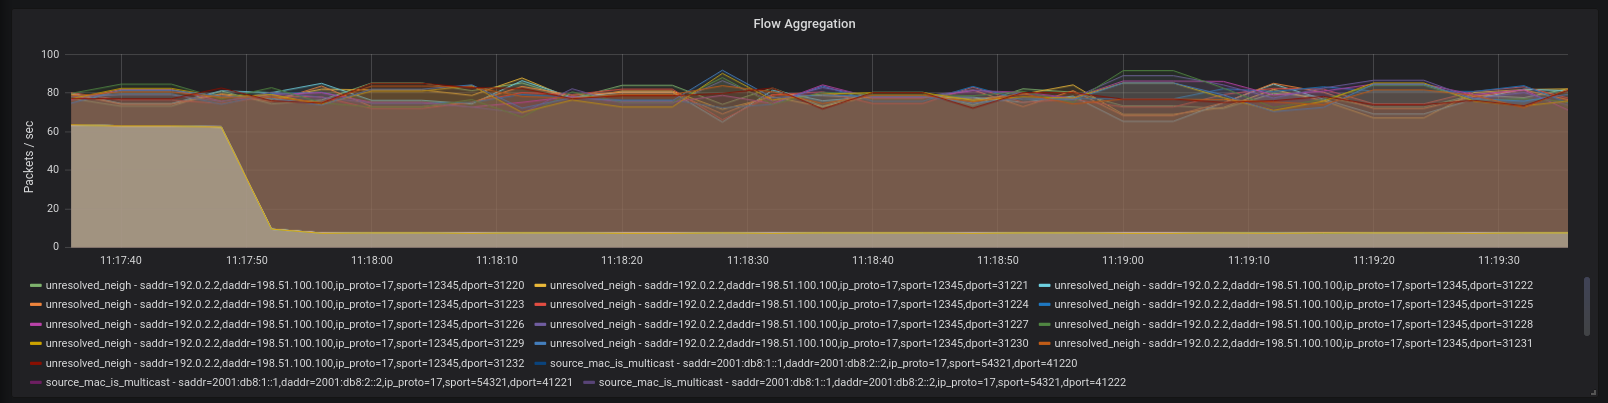
The exporter will install an eBPF program in the kernel which will efficiently provide per-{flow, trap} statistics to user space via an eBPF map.
As with devlink-exporter, it is possible to use Grafana to visualize
the information:
On Spectrum-2 and above, mlxsw can configure mirroring of packets dropped
due to buffer pressure and ECN-marked packets. This feature is configured
through filters attached to qevent blocks.
- man dropwatch
- man dumpcap
- man wireshark
- man tshark
- man wireshark-filter
- man devlink-trap
- man dwdump