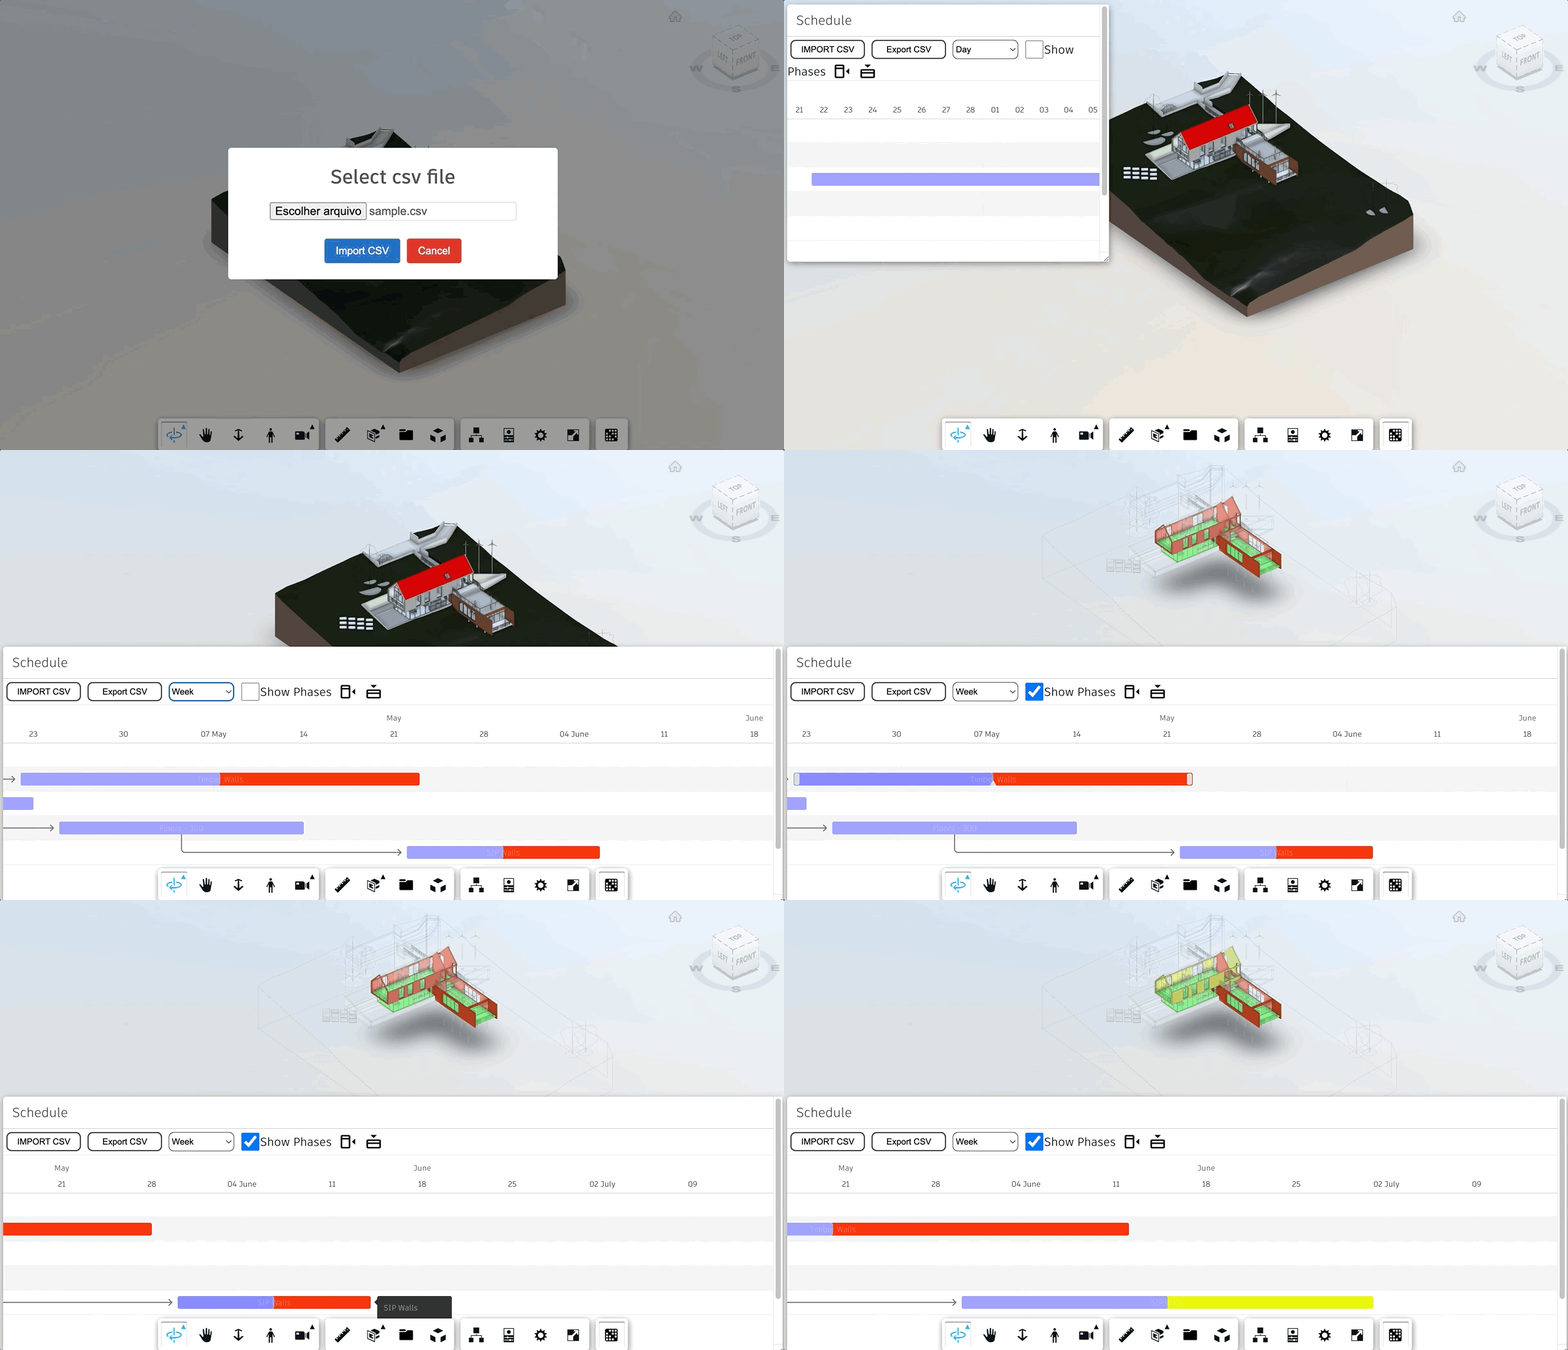
This sample demonstrates a way to add a Gantt chart with tasks connected to the elements of the loaded model. It leverages the new Dashboard and the Simple Viewer tutorials (with a few modifications). Feel free to also use .NET version and Hubs Browser if you prefer.
Especifically in this repo, we're using the minimal configuration to store only what's really important (the content under wwwroot/extensions folder).
The sample is based in a configuration defined by a csv in order to map all the available elements in viewer, then categorize them into different tasks. It uses frappe/gantt as dependency.
To make this sample generic, we take advantage of a config.json and an input csv.
You can find a csv to test with the model loaded here
The config.json file specify the way the sample connect the model data with the csv data, and also how it will override the colors of the model to represent the current progress.
The input csv file defines the tasks that will appear on the GANTT chart.
- Generate the GANTT chart based on
csvinput, with elements connected to the tasks defined. - Generate a graphic representation of the progress on the model based on the GANTT chart (overriding elements colors).
You can run this sample live here:
https://joaomartins-forge.github.io/construction-phasing-tutorial/wwwroot/index.html
and the recording demonstrating how to run here:
https://www.youtube.com/watch?v=
- Forge Account: Learn how to create a Forge Account, activate subscription and create an app at this tutorial.
- Base App: A basic app from our new tutorial. This can be either Simple Viewer or Hubs Browser. Select any of them (in NODE or .NET) as a base to integrate with client side. This extension is based on Basic Extension, also available on our new tutorial.
To use this sample, you need an Autodesk developer credentials. Visit the Forge Developer Portal, sign up for an account, then create an app. For this new app, use http://localhost:3000/api/forge/callback/oauth as Callback URL. Finally take note of the Client ID and Client Secret.
You can take advantage of this extension by adding the phasingExtension.js, PhasingPanel.jsand config.js files in your app.
You can add those under wwwroot/extensions folder, if you want to take advantage of Simple Viewer or Hubs Browser tutorials.
It's also requires to reference SweetAlert2 library in index.html:
...
<script src="https://cdn.jsdelivr.net/npm/sweetalert2@11"></script>
...
And reference the extension in vieweration (for the tutorials, it's done at wwwroot/viewer.js):
onst config = {
    extensions: [
        'PhasingExtension'
    ]
};
const viewer = new Autodesk.Viewing.GuiViewer3D(container, config);This sample is licensed under the terms of the MIT License. Please see the LICENSE file for full details.
João Martins @JooPaulodeOrne2, Developer Advocate and Support


