Package to generate Chart.js charts directly from Laravel/Blade, without interacting with JavaScript.
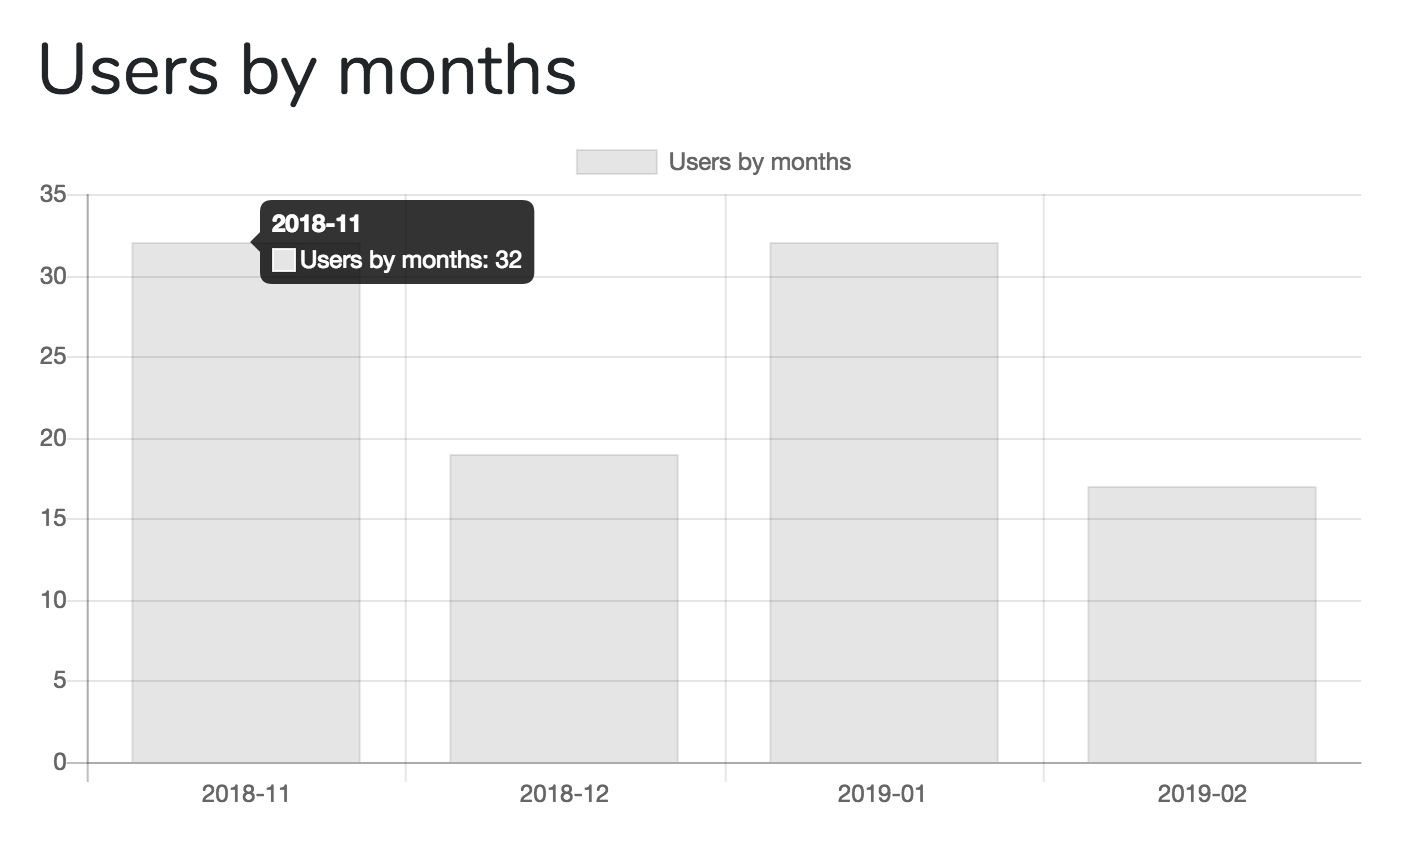
If you want to generate a chart above, grouping users records by the month of created_at value, here's the code.
Controller:
use LaravelDaily\LaravelCharts\Classes\LaravelChart;

// ...

$chart_options = [
    'chart_title' => 'Users by months',
    'report_type' => 'group_by_date',
    'model' => 'App\Models\User',
    'group_by_field' => 'created_at',
    'group_by_period' => 'month',
    'chart_type' => 'bar',
];
$chart1 = new LaravelChart($chart_options);

return view('home', compact('chart1'));
View File
@extends('layouts.app')

@section('content')
<div class="container">
    <div class="row justify-content-center">
        <div class="col-md-8">
            <div class="card">
                <div class="card-header">Dashboard</div>

                <div class="card-body">

                    <h1>{{ $chart1->options['chart_title'] }}</h1>
                    {!! $chart1->renderHtml() !!}

                </div>

            </div>
        </div>
    </div>
</div>
@endsection

@section('javascript')
{!! $chart1->renderChartJsLibrary() !!}
{!! $chart1->renderJs() !!}
@endsection
composer require laraveldaily/laravel-chartsNo additional configuration or other parameters yet.
You need to create LaravelChart object in your Controller, passing array of options.
$chart = new LaravelChart($options);Then pass it to the View, as a variable:
return view('dashboard', compact('chart'));Currently package support three types of charts/reports:
group_by_date- amount of records from the same table, grouped by time period - day/week/month/year;group_by_string- amount of records from the same table, grouped by any string field, likename;group_by_relationship- amount of records from the same table, grouped bybelongsTorelationship's field
Example with all options
$chart_options = [
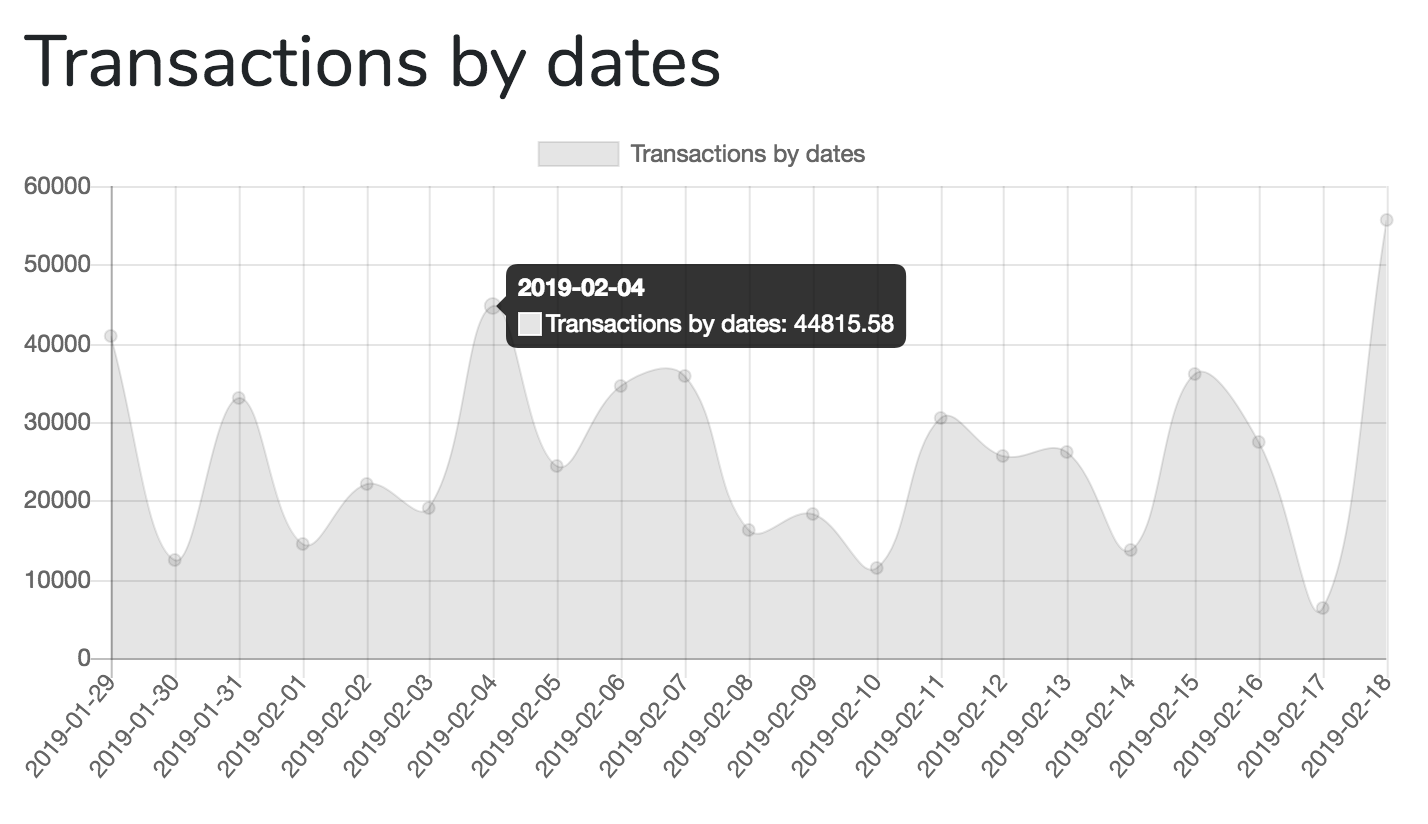
'chart_title' => 'Transactions by dates',
'chart_type' => 'line',
'report_type' => 'group_by_date',
'model' => 'App\Models\Transaction',
'conditions' => [
['name' => 'Food', 'condition' => 'category_id = 1', 'color' => 'black', 'fill' => true],
['name' => 'Transport', 'condition' => 'category_id = 2', 'color' => 'blue', 'fill' => true],
],
'group_by_field' => 'transaction_date',
'group_by_period' => 'day',
'aggregate_function' => 'sum',
'aggregate_field' => 'amount',
'aggregate_transform' => function($value) {
return round($value / 100, 2);
},
'filter_field' => 'transaction_date',
'filter_days' => 30, // show only transactions for last 30 days
'filter_period' => 'week', // show only transactions for this week
'continuous_time' => true, // show continuous timeline including dates without data
];chart_title(required) - just a text title that will be shown as legend;chart_type(required) - possible values: "line", "bar", "pie";report_type(required) - see above, can begroup_by_date,group_by_stringorgroup_by_relationship;model(required) - name of Eloquent model, where to take the data from;name(optional) - just a text title that will be shown as title, otherwise the legend is used;conditions(optional, only forlinechart type) - array of conditions (name + raw condition + color) for multiple datasets;group_by_field(required) - name of database field that will be used ingroup_byclause;group_by_period(optional, only forgroup_by_datereport type) - possible values are "day", "week", "month", "year";relationship_name(optional, only forgroup_by_relationshipreport type) - the name of model's method that containsbelongsTorelationship.aggregate_function(optional) - you can view not only amount of records, but also theirSUM()orAVG(). Possible values: "count" (default), "avg", "sum".aggregate_field(optional) - seeaggregate_functionabove, the name of the field to use inSUM()orAVG()functions. Irrelevant forCOUNT().aggregate_transform(optional) - callback function for additional transformation of aggregate numberfilter_field(optional) - show only data filtered by that datetime field (see below)filter_days(optional) - seefilter_fieldabove - show only lastfilter_daysdays of that field. Example, last 30 days bycreated_atfield.filter_period(optional) - another way to filter by field, show only record from last week / month / year. Possible values are "week", "month", "year".continuous_time(optional) - show all dates on chart, including dates without data.show_blank_data(optional) - show date even if the data is blank based onfilter_days.range_date_start(optional) - show data in from a date range byfilter_field, this is the start date.range_date_end(optional) - show data in from a date range byfilter_field, this is the end date.field_distinct(optional) - field name required, it will apply a distinct(fieldname)style_class(optional) - add class css in canvasdate_format(optional) - add the date format, by default: American format Y-m-dwhere_raw(optional) - Condition in multiple consultation situationschart_height(optional) - add the height in options, default 300pxdate_format_filter_days(optional) - add the date format for Filter dayswithoutGlobalScopes(optional) - removes global scope restriction from queried modelwith_trashed(optional) - includes soft deleted modelsonly_trashed(optional) - only displays soft deleted modelstop_results(optional, integer) - limit number of results shown, see Issue #49chart_color(optional, value in rgba, like "0,255,255") - defines the color of the chartlabels(optional, array with key and value) - defines key value array mapping old and new valueshidden(optional, boolean) hides the current dataset. Useful when having multiple datasets in one chartstacked(optional, boolean, only for bar chart) stacks the chart data when dates or strings match instead of showing it next to eachother
$chart_options = [
    'chart_title' => 'Transactions by user',
    'chart_type' => 'line',
    'report_type' => 'group_by_relationship',
    'model' => 'App\Models\Transaction',

    'relationship_name' => 'user', // represents function user() on Transaction model
    'group_by_field' => 'name', // users.name

    'aggregate_function' => 'sum',
    'aggregate_field' => 'amount',

    'filter_field' => 'transaction_date',
    'filter_days' => 30, // show only transactions for last 30 days
    'filter_period' => 'week', // show only transactions for this week
];After you passed $chart variable, into Blade, you can render it, by doing three actions:
Action 1. Render HTML.
Wherever in your Blade, call this:
{!! $chart1->renderHtml() !!}It will generate something like this:
<canvas id="myChart"></canvas>Action 2. Render JavaScript Library
Package is using Chart.js library, so we need to initialize it somewhere in scripts section:
{!! $chart1->renderChartJsLibrary() !!}It will generate something like this:
<script src="https://cdnjs.cloudflare.com/ajax/libs/Chart.js/2.5.0/Chart.min.js"></script>Action 3. Render JavaScript of Specific Chart
After Chart.js is loaded, launch this:
{!! $chart1->renderJs() !!}You can show multiple charts on the same page, initialize them separately.
Controller:
public function index()
{
    $chart_options = [
        'chart_title' => 'Users by months',
        'report_type' => 'group_by_date',
        'model' => 'App\Models\User',
        'group_by_field' => 'created_at',
        'group_by_period' => 'month',
        'chart_type' => 'bar',
        'filter_field' => 'created_at',
        'filter_days' => 30, // show only last 30 days
    ];

    $chart1 = new LaravelChart($chart_options);


    $chart_options = [
        'chart_title' => 'Users by names',
        'report_type' => 'group_by_string',
        'model' => 'App\Models\User',
        'group_by_field' => 'name',
        'chart_type' => 'pie',
        'filter_field' => 'created_at',
        'filter_period' => 'month', // show users only registered this month
    ];

    $chart2 = new LaravelChart($chart_options);

    $chart_options = [
        'chart_title' => 'Transactions by dates',
        'report_type' => 'group_by_date',
        'model' => 'App\Models\Transaction',
        'group_by_field' => 'transaction_date',
        'group_by_period' => 'day',
        'aggregate_function' => 'sum',
        'aggregate_field' => 'amount',
        'chart_type' => 'line',
    ];

    $chart3 = new LaravelChart($chart_options);

    return view('home', compact('chart1', 'chart2', 'chart3'));
}View:
@extends('layouts.app')

@section('content')
<div class="container">
    <div class="row justify-content-center">
        <div class="col-md-8">
            <div class="card">
                <div class="card-header">Dashboard</div>

                <div class="card-body">

                    <h1>{{ $chart1->options['chart_title'] }}</h1>
                    {!! $chart1->renderHtml() !!}

                <hr />

                    <h1>{{ $chart2->options['chart_title'] }}</h1>
                    {!! $chart2->renderHtml() !!}

                    <hr />

                    <h1>{{ $chart3->options['chart_title'] }}</h1>
                    {!! $chart3->renderHtml() !!}

                </div>

            </div>
        </div>
    </div>
</div>
@endsection

@section('javascript')
{!! $chart1->renderChartJsLibrary() !!}

{!! $chart1->renderJs() !!}
{!! $chart2->renderJs() !!}
{!! $chart3->renderJs() !!}
@endsection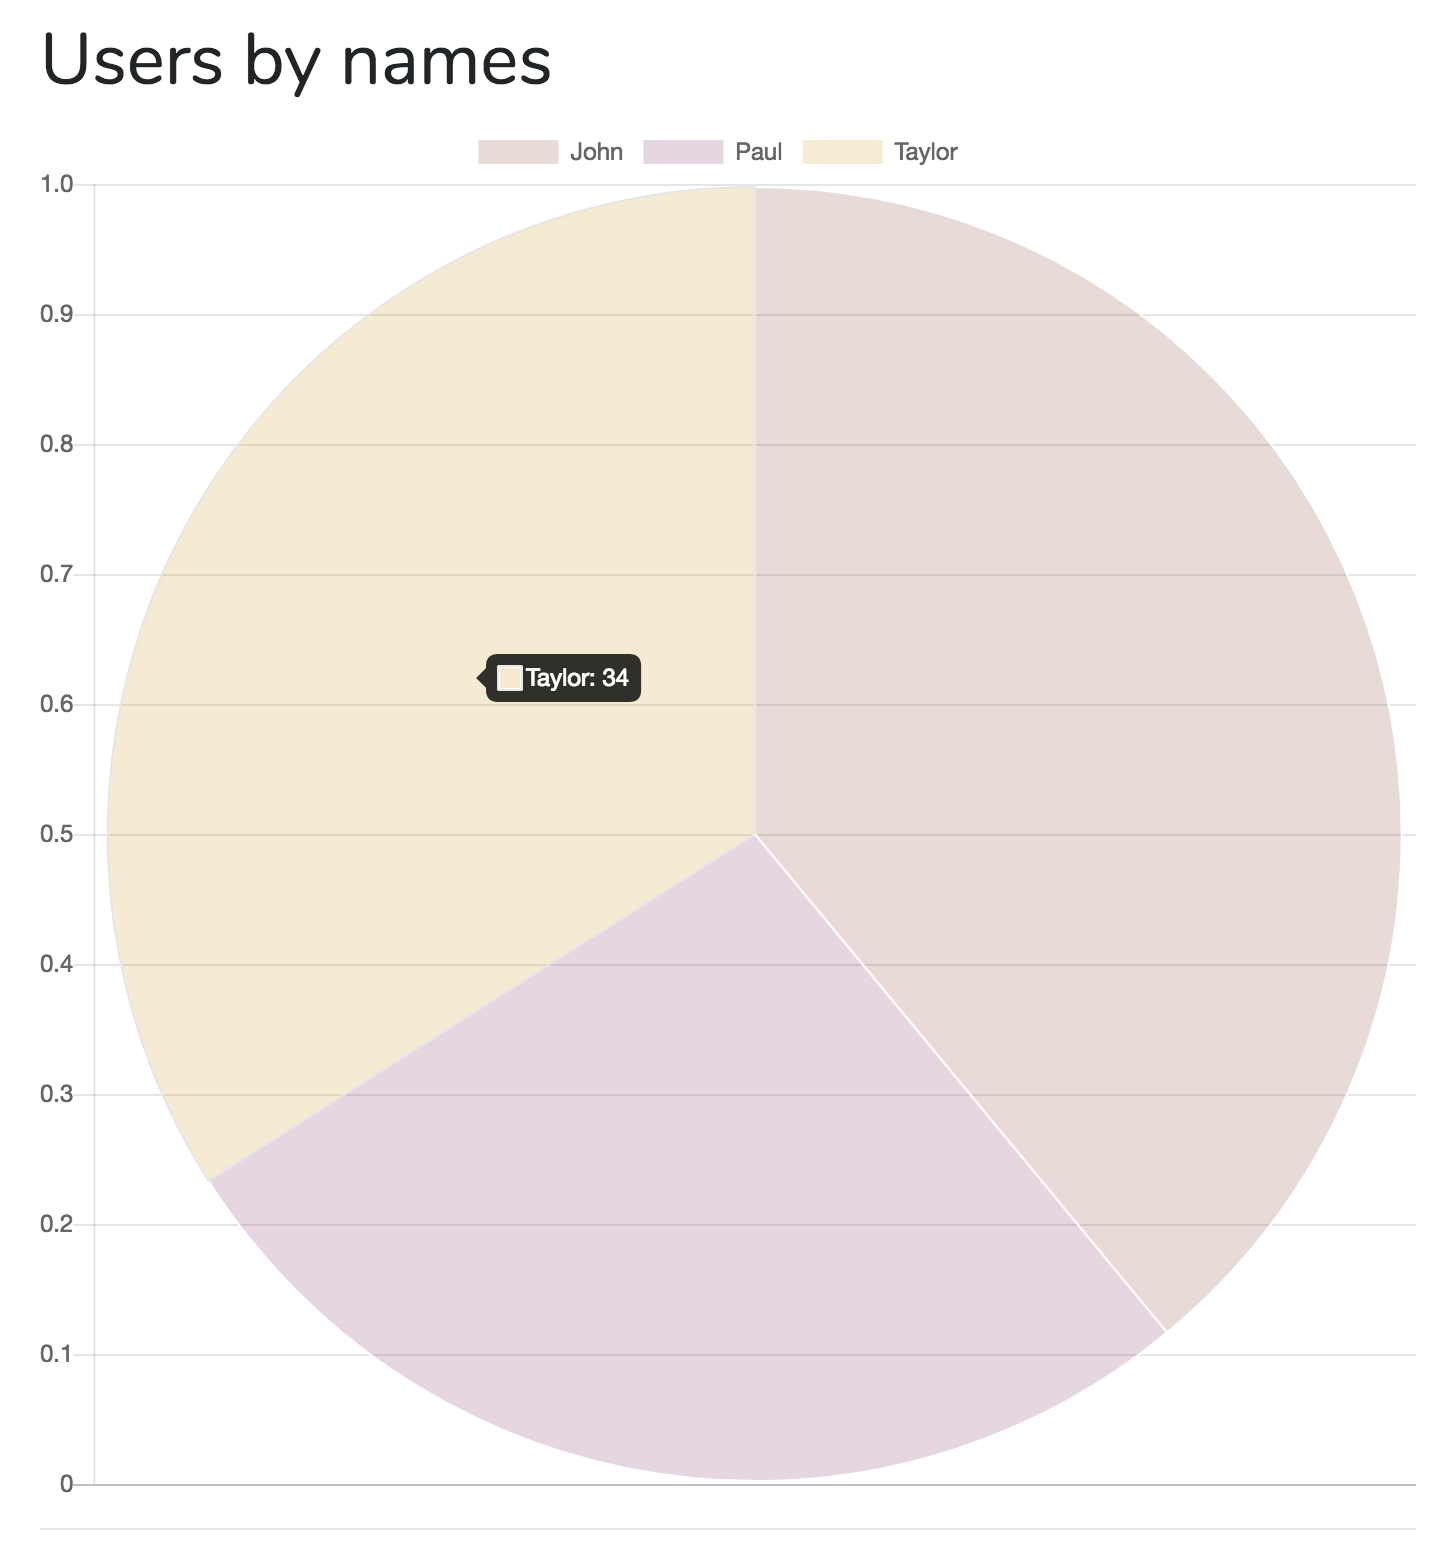
This is a new feature from v0.1.27. You can provide multiple arrays of settings to the LaravelChart constructor, and they will be drawn on the same chart.
$settings1 = [
    'chart_title'           => 'Users',
    'chart_type'            => 'line',
    'report_type'           => 'group_by_date',
    'model'                 => 'App\Models\User',
    'group_by_field'        => 'created_at',
    'group_by_period'       => 'day',
    'aggregate_function'    => 'count',
    'filter_field'          => 'created_at',
    'filter_days'           => '30',
    'group_by_field_format' => 'Y-m-d H:i:s',
    'column_class'          => 'col-md-12',
    'entries_number'        => '5',
    'translation_key'       => 'user',
    'continuous_time'       => true,
];
$settings2 = [
    'chart_title'           => 'Projects',
    'chart_type'            => 'line',
    'report_type'           => 'group_by_date',
    'model'                 => 'App\Models\Project',
    // ... other values identical to $settings1
];

$chart1 = new LaravelChart($settings1, $settings2);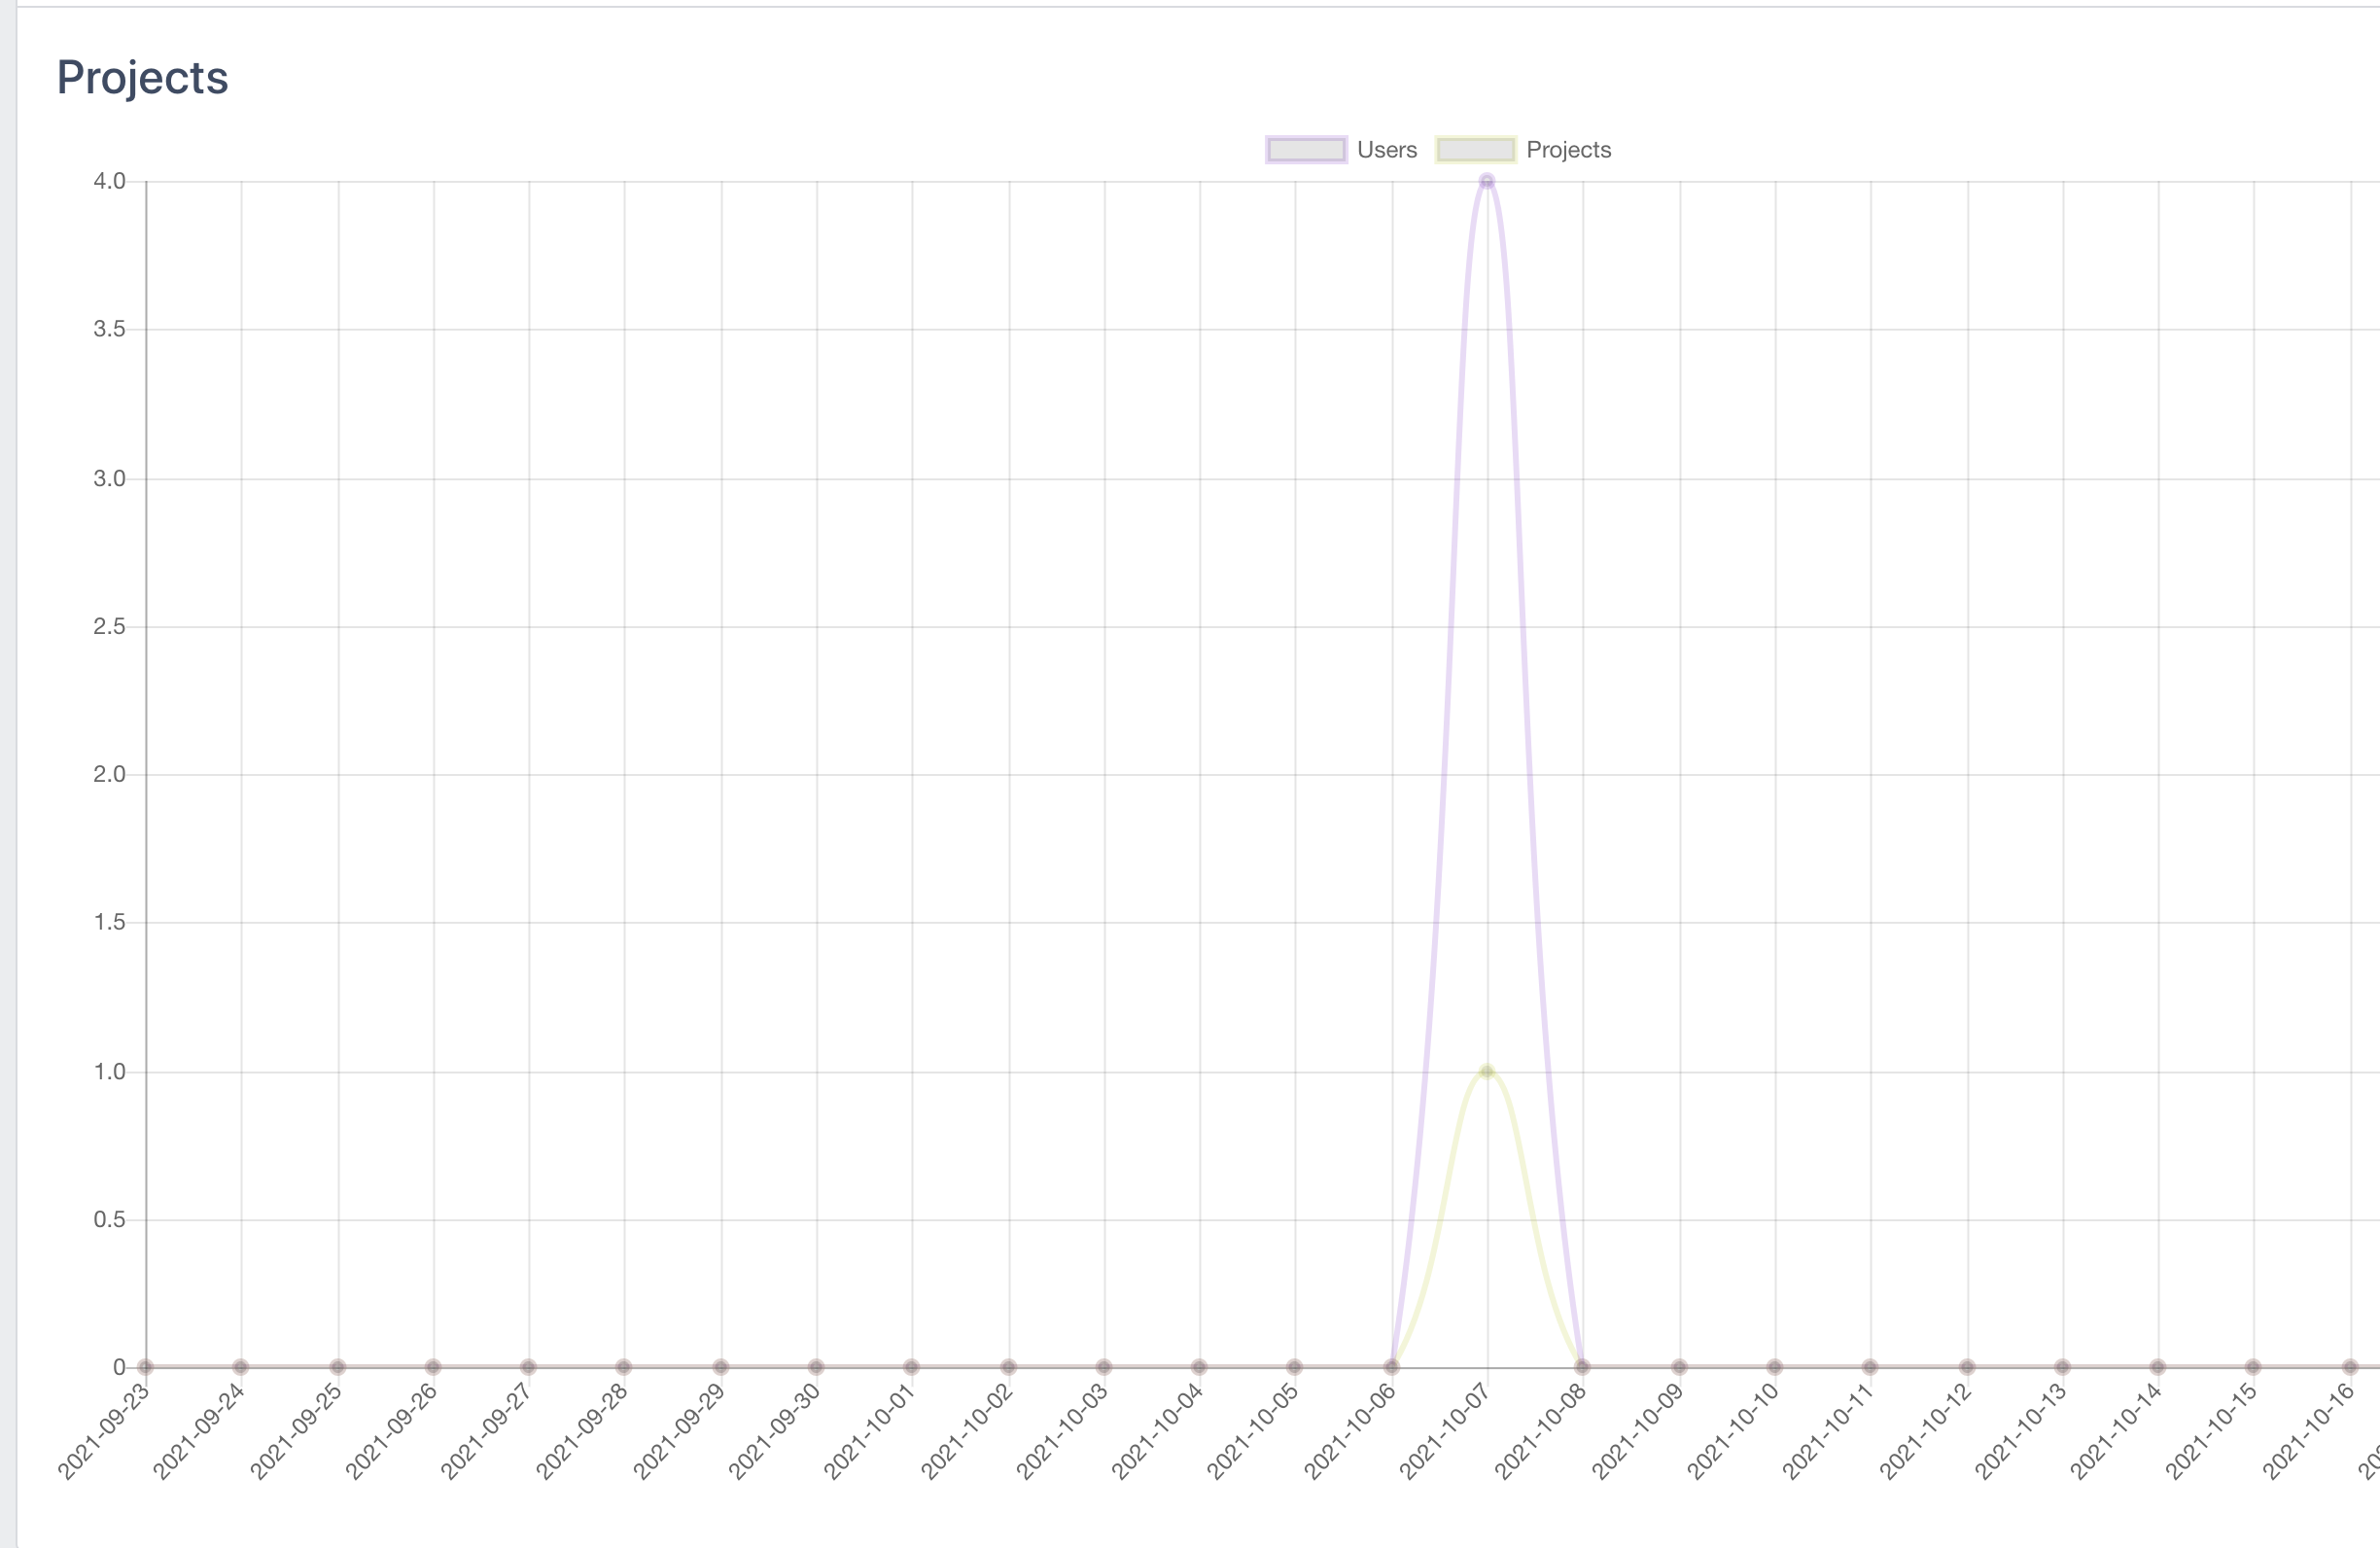
The MIT License (MIT). Please see License File for more information.
- Enroll in our Laravel Online Courses
- Check out our adminpanel generator QuickAdminPanel
- Subscribe to our YouTube channel Laravel Daily