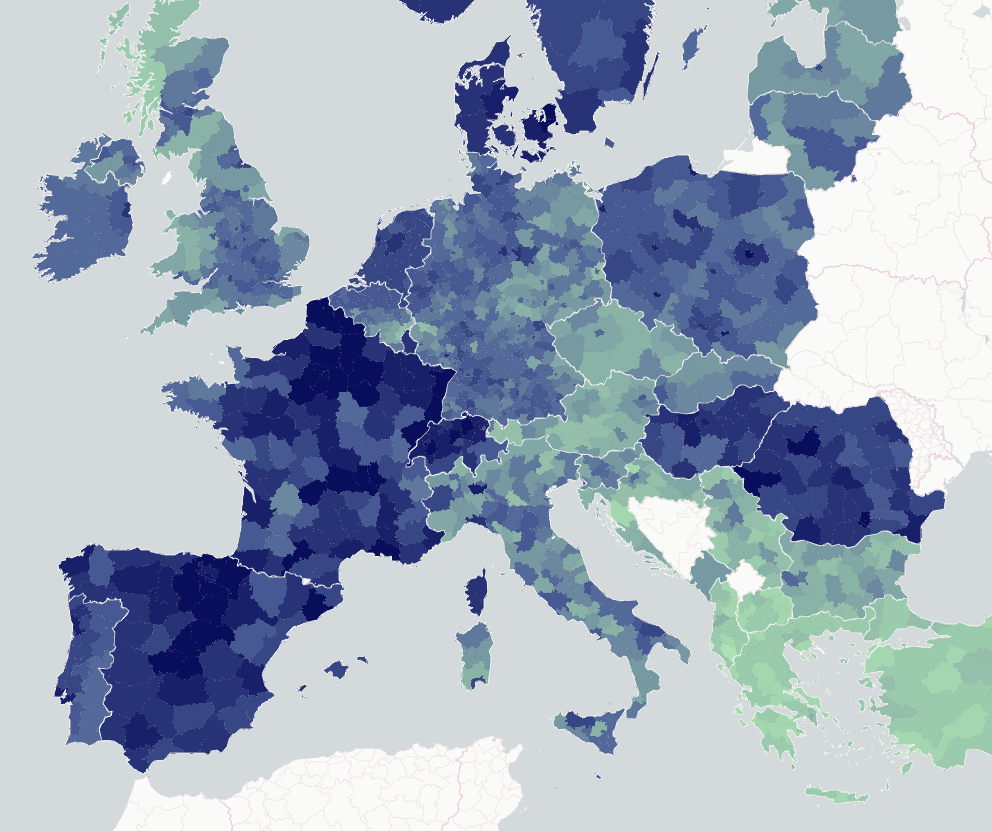
The goal of this project is to create a dashboard on internet performance across Europe where people, but mainly journalists, can navigate the data for different territorial levels - from countries to cities - and download them in a tabular format for reuse. This ultimately “opens” the data for non-data-savvy professionals who might want to use this information.
This project combines two open data sources:
- the internet performances data provided by Speedtest by Ookla Global Fixed and Mobile Network Performance Maps, based on analysis by Ookla of Speedtest Intelligence data. Available through the library
ooklaOpenDataR; - the geometries of European territorial units (local administrative units (LAU) and regions/districts (NUTS2/NUTS3)) distributed by Eurostat for EU Member States, EU official candidate countries, and EFTA countries. Available through the library
latlon2map.
The analysis and the preparation of all the elements for the dashboard consists of 6 steps, and as many scripts.
1-data_analysis.Rconsists of a loop that downloads the raw data from Ookla, executes the geocomputation and performs the tidying necessary to store the raw files and the outputs of the analysis;2-lau_nuts_matching.Rmatches the European cities with their respective regions, as this is not directly provided by Eurostat but it's needed for the comparisons we show in the dashboard;3-maps.Rcreates and saves interactive html maps withleafletfor every NUTS2 region and country, as well as European maps;4-density_plots.Rcreates and saves static density plots useful to compare the internet speed distribution between a region, the country it is located, and Europe;5-prepare_viz_for_dashboard.Ris used to standardise the encoding and clean the visualizations' names from white spaces and commas in order to properly show the elements in the dashboard;6-data_for_tables.Rcreates the structure of the tables as shown in the dashboard. The tables have been visualized with Datawrapper.
The data is provided by Ookla every quarter from Q1 2019.
In the data folder, it is possible to download the datasets for every quarter since Q1 2019 for every territorial unit (lau, nuts3, nuts2, nuts0) as well as the time series for every territorial unit.
The data structure is common to every file, consisting of:
id, the Eurostat id code of the territorial unit;name, the name of the territorial unit;quarter, the quarter to which the measurements refer to;avg_d, average download speed in megabit per second (Mbps);avg_u, average upload speed in megabit per second (Mbps);avg_l, average latency in milliseconds (ms).
This project is licensed under the Creative Commons Attribution 4.0 International (CC BY-SA 4.0). To cite this project please refer to the European Data Journalism Network, as well as the data provider (Speedtest by Ookla Global Fixed and Mobile Network Performance Maps).
