This repository contains the software and data associated with the manuscript "Lightweight multi-scale early warning system for influenza A spillovers" by Alfonsi T., Bernasconi A., Chiara M., and Ceri S.
The software takes as input files the metadata and HA genomes of Influenza viruses formatted as .xls files for metadata and .fasta files for the genomes.
The software is organized in three stages, where each stage depends on the output of the previous one:
- Sequence Alignment
- Data Processing
- Data Visualization
Each stage is distributed as a docker service to be executed independently.
The software is packaged without input data. Users should retrieve it independently through their registred accounts on GISAID. The following sections describe how to use the data available on GISAID with the software to reproduce the analysis described in the associated manuscript.
In the EpiFlu database, Search tab, run two separate searches to retrieve datasets, respectively of H1N1 and H5N1.
For H1N1 select:
- Type=A
- H=1
- N=1
- Host="Human" and "mammals"
- Location=North America or any subset
- Collection date between July 28, 2008 and January 10, 2010
- Check "Collection date complete"
- Required Segments=HA
For H5N1 select:
- Type=A
- H=5
- N=1
- Host="-all-"
- Location=North America or any subset
- Collection date between January 1, 2019 and July 25, 2025
- Check "Collection date complete"
- Required Segments=PB2,PB1,PA,HA,NP,NA,MP,NS
Click the "Search" button at the end of the page. Select all the records and click the "Download" button.
Download:
-
Isolates as XLS (virus metadata only) in
gisaid_epiflu_isolates.xls -
Sequences (DNA) as FASTA in
gisaid_epiflu_sequence.fastaPlease note that:
- The fasta header must have the format "DNA Accession no. | Isolate ID | Isolate name | Type | Lineage | Clade | Segment" and any date must be formatted as 'YYYY-MM-DD'. Spaces must be replaced with underscores and removed before and after values in the FASTA header
- the data availability may change during time, therefore some differences with the results described in the manuscript are expected
- the Data Visualization stage includes filters on the Collection_Date and Location of the input sequences. In order to fully display your input, ensure the sequences are collected in North America, between July 28, 2008 and January 10, 2010 for H1N1 data, and between January 1, 2019 and May 5, 2025 for H5N1 data.
Reference sequences for H1N1 and H5N1 are already provided in inputs > references and correspond to the following isolates/sequences on NCBI Nucleotide DB:
- NC_026433.1 Influenza A virus (A/California/07/2009(H1N1)) segment 4 hemagglutinin (HA) gene, complete cds
- AF144305.1 Influenza A virus (A/Goose/Guangdong/1/96(H5N1)) hemagglutinin (HA) gene, complete cds
Docker Desktop is required to configure and run this software. If your computer already has Docker Desktop installed, you can skip to the next section (Software Setup), otherwise:
- Download and install Docker Desktop by following the instructions provided at https://docs.docker.com/get-started/get-docker/.
- Open Docker Desktop on your computer.
- [optional] In the Docker Destkop interface, look for notifications or messages about possible problems and fixes concerning the installation of docker and its sub-components.
- For Apple computers with Apple Silicon CPU, please update Docker Desktop to version 4.16 at least and enable the option Rosetta 2 Virtualization in the General settings;
- For ARM-based architectures (including Apple Silicon CPUs), we suggest adding the line
platform: linux/amd64to every service in the docker-compose.yaml file in case the previous workaround is not possible or effective.
The software requires a terminal window to execute the commands:
- on Windows use the "Command Prompt" or the "Power Shell" version 7+.
- on Linux/MacOS use the default terminal window.
Open the terminal, navigate to the current directory (where this README.md file is located) and run the command docker-compose build to prepare the software.
Preprare the input for the data_alignment package by copying the isolates' HA genomes inside the proper directory:
- for H1N1 data: put the files into
inputs > H1N1 - for H5N1 data: put the files into
inputs > H5N1
The files should be named as gisaid_epiflu_isolates.xls and gisaid_epiflu_sequence.fasta.
Open a terminal window, then separately launch the alignment procedure for H1N1 and H5N1 data with the commands:
docker-compose down --remove-orphans && docker-compose run data_alignment H1N1ordocker-compose down --remove-orphans && docker-compose run data_alignment H5N1
This stage terminates with the generation of two pairs (one for serotype) of .fasta and .insertions.csv files in the alignments directory.
Open a terminal window, then separately launch the data processing stage for H1N1 and H5N1 data with the commands:
docker-compose down --remove-orphans && docker-compose run data_processing H1N1ordocker-compose down --remove-orphans && docker-compose run data_processing H5N1
This stage terminates with the generation of the files H1N1.sqlite and H5N1.sqlite in the output directory.
Open a terminal window and:
- launch the visualization server with the command
docker-compose up --remove-orphans data_visualization - open a browser window at the url http://localhost:60119/
When necessary, shutdown the visualization server by pressing [Ctrl+C] on Windows / Linux and [Cmd+C] on MacOS.
Below, an example of the visualization of the H1N1 dataset, with filters on Host Type and Location (North America); the aggregated warning counts in multiple N,k configurations; a table for inspecting metadata of 1) all individual sequences in the dataset and 2) warning sequences in the different configurations; an interactive map to visualize geo-located warnings (choosing N,k and a specific bi-week as parameters) — here we selected N = 50, k = 10 in the 17/18th week of 2009, showing several warnings widespread in many US states.

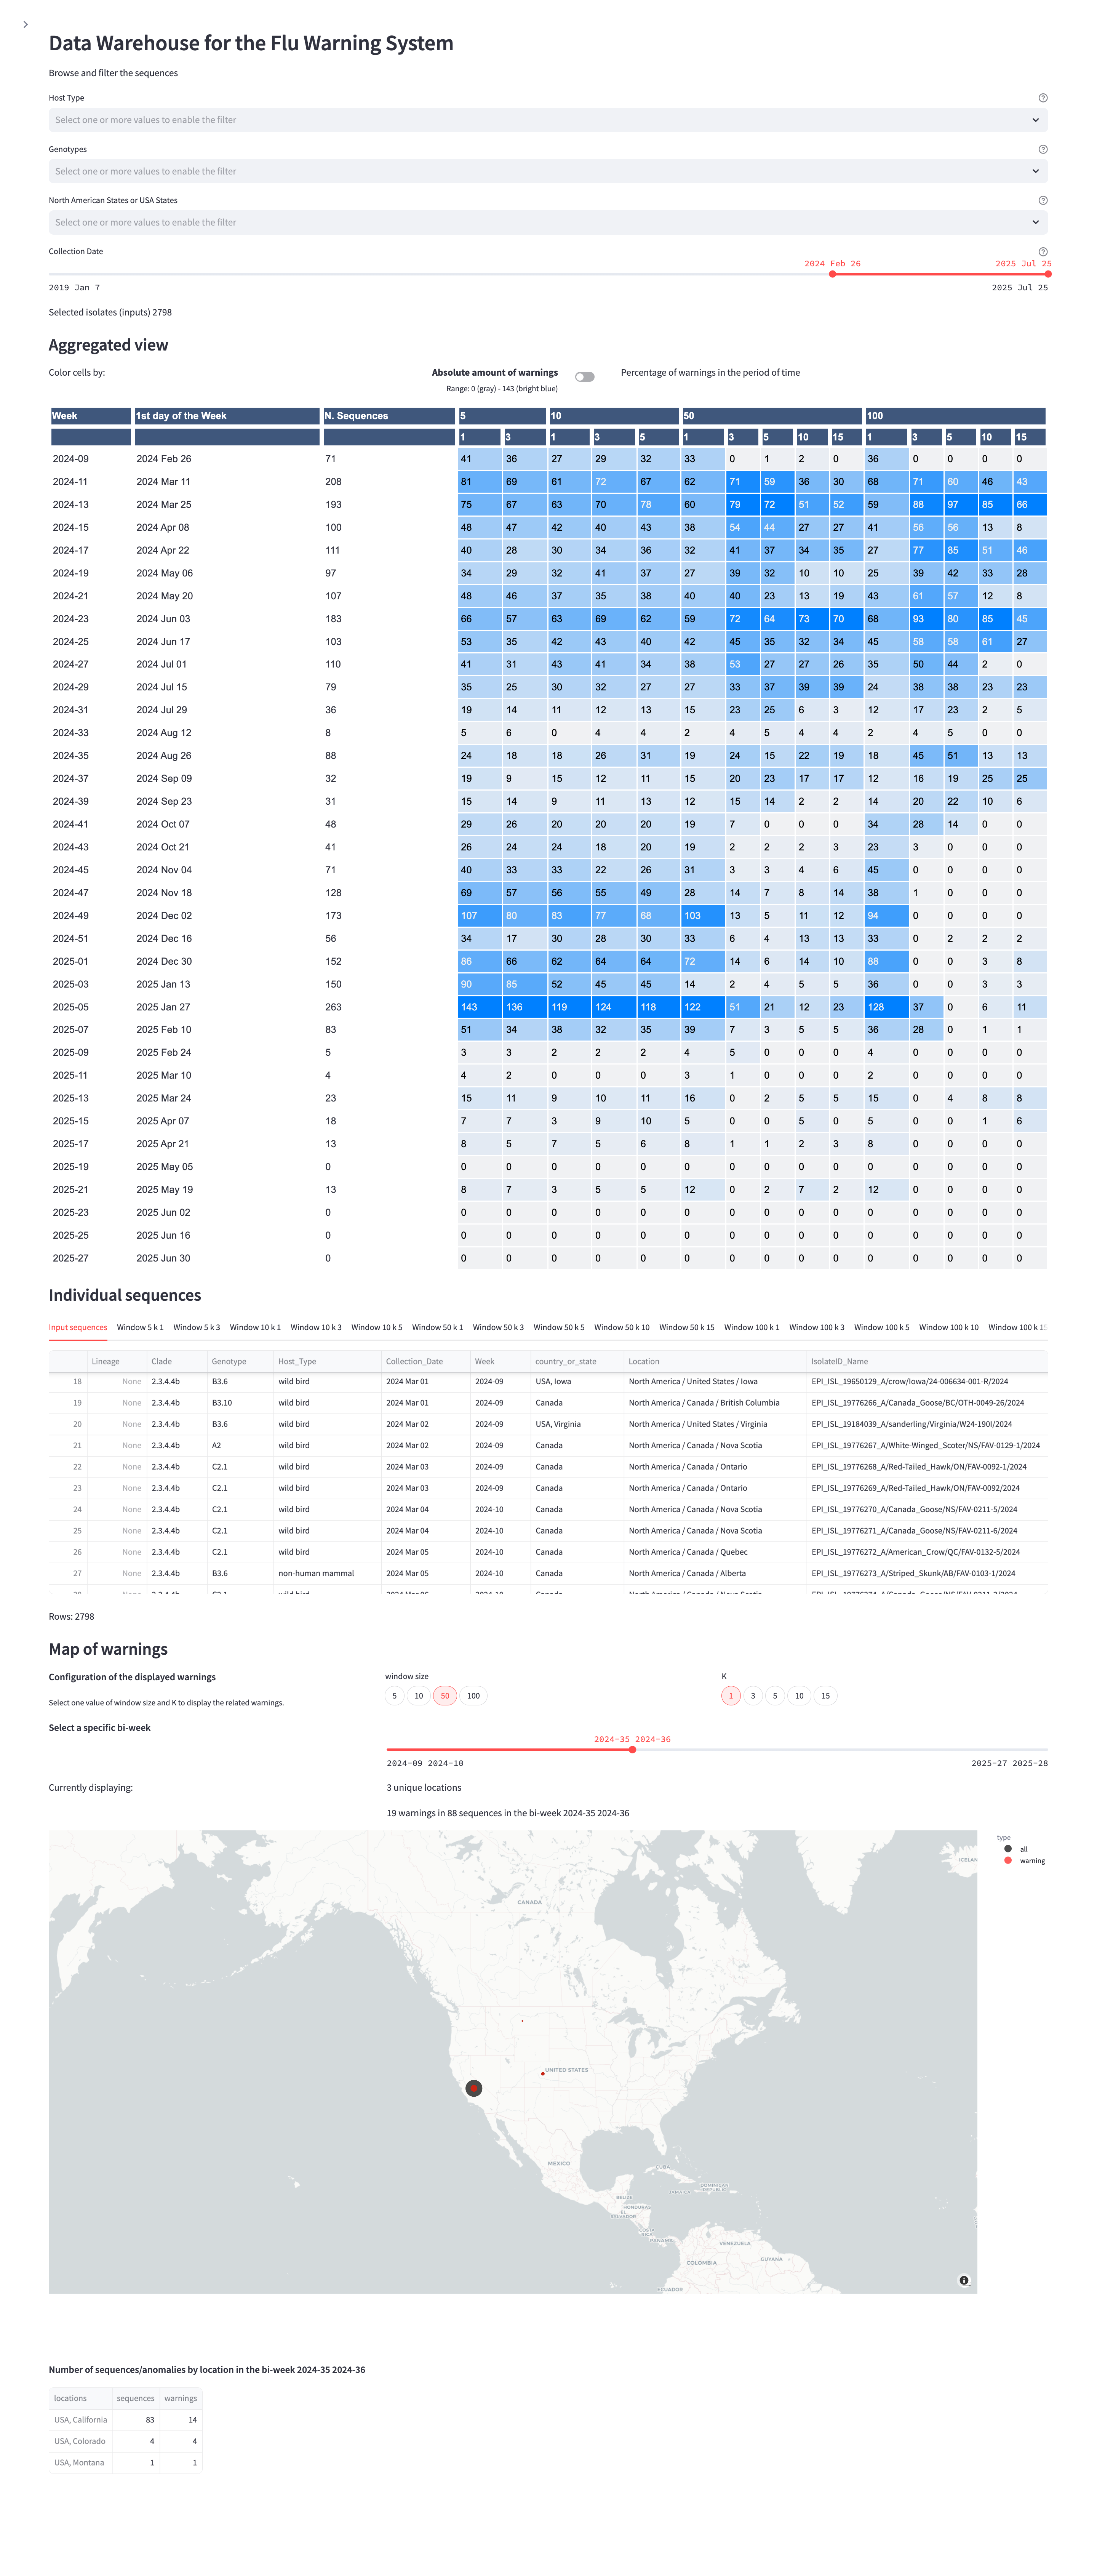
Below, an example of the visualization of the H5N1 dataset, with filters on Host Type, Genotype, Location (North America), and time span of Collection Dates; the aggregated warning counts in multiple N,k configurations. As for H1N1, we also show a table for inspecting metadata of 1) all individual sequences in the dataset and 2) warning sequences in the different configurations; then, an interactive map to visualize geo-located warnings (choosing N,k and a specific bi-week as parameters) — here we selected N = 50, k = 1 in the 35/36th week of 2024, showing the first warnings in California.
See the LICENSE file.